
Desktop Survival Guide
by Graham Williams
|
|
DATA MINING
Desktop Survival Guide by Graham Williams |
|
|||
Arrow Axes |


|
The par function in R can be used to fine tune characteristics of a plot. Here we add arrows to the axes. For many more arrow options see the p.arrows function in the sfsmisc package.
In the example here, par("usr") is used to identify the bounds
of the plot, and these are then employed to draw axes with arrows. The
arrows function takes a starting point and an ending
point for the line to be drawn. The code=2 selects the type of
arrow head to draw and the xpd=TRUE ensures the arrows are not
cropped to the default size of the plot (the plot region).
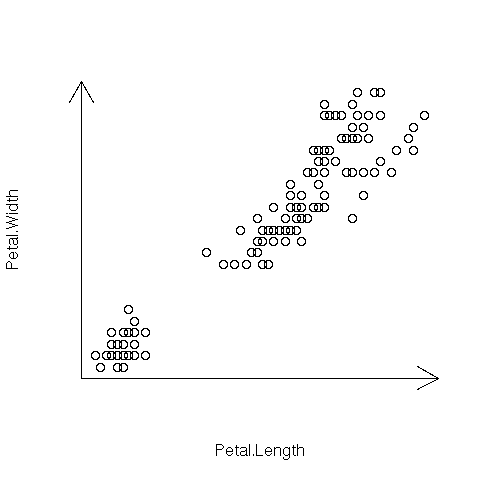
attach(iris)
plot(Petal.Length, Petal.Width, axes=FALSE)
u <- par("usr")
arrows(u[1], u[3], u[2], u[3], code=2, xpd=TRUE)
arrows(u[1], u[3], u[1], u[4], code=2, xpd=TRUE)
|