Desktop Survival Guide
by Graham Williams


|
DATA MINING
Desktop Survival Guide by Graham Williams |

|
|||
Bar Charts With Segments |
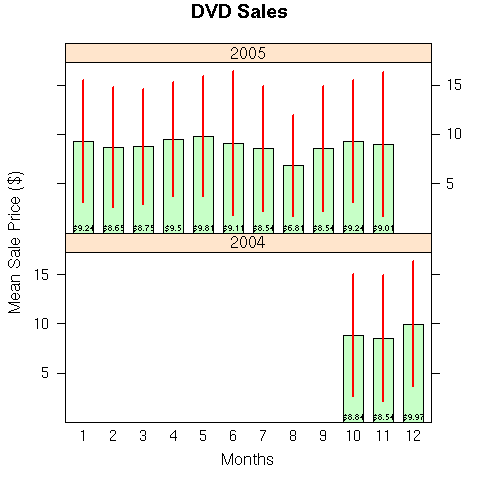
In this example we illustrate one of the powerful features of the barchart function (and others) in the lattice package. In addition to drawing the two basic barcharts (one corresponging to each year of the data) we also want to include standard deviation bars. This is achieved by drawing the normal barcharts but adding, through the use of the panel argument, the standard deviation plots.
First we create a data frame recording the mean sale price of an item each month, its standard deviation, and the number of items sold. We then attach the data frame so we can more easily refer to the column names within the barchart call without having to prefix them with the data frame name. We also choose a white background using trellis.par.set.

A barchart is then constructed to plot the Mean across Month, by Year. The layout specifies a single column, and as many years as in the data. The ylim ensures we have enough space to draw the standard deviation bars. Next the StdDev is assigned to sd, and the panel function is defined to make use of sd. This draws the actual barchart and adds panel segments corresponding to the values in sd for the specific panel (as identified in the subscripts argument). We also include on the graphic the actual mean dollar amount.
# Suggested by Sandeep Ghosh
library(lattice)

prices <- matrix(c(10, 2004, 8.84, 6.18, 524,
                   11, 2004, 8.54, 6.35, 579,
                   12, 2004, 9.97, 6.31, 614,
                    1, 2005, 9.24, 6.18, 634,
                    2, 2005, 8.65, 6.05,  96,
                    3, 2005, 8.75, 5.84,  32,
                    4, 2005, 9.50, 5.75,  96,
                    5, 2005, 9.81, 6.10, 165,
                    6, 2005, 9.11, 7.29,   8,
                    7, 2005, 8.54, 6.35, 579,
                    8, 2005, 6.81, 5.15,  16,
                    9, 2005, 8.54, 6.35, 579,
                   10, 2005, 9.24, 6.18, 634,
                   11, 2005, 9.01, 7.29,   8),
                 ncol=5, byrow=TRUE)
prices <- as.data.frame(prices)
colnames(prices) <- c("Month", "Year", "Mean","StdDev","Count")
prices$Month <- factor(prices$Month)      # Turn Month into a categorical
prices$Year <- factor(prices$Year)        # Turn Year into a categorical

attach(prices)

pdf("graphics/rplot-bar-complex.pdf")

trellis.par.set(theme = col.whitebg())
barchart(Mean ~ Month | Year, data=prices,
         layout=c(1, length(levels(Year))),
         ylim=c(0, max(Mean) + max(StdDev)),
         main="DVD Sales",
         xlab="Months",
         ylab="Mean Sale Price ($)",
         sd=StdDev,
         panel=function(x, y, ..., sd, subscripts)
         {
           panel.barchart(x, y, ...)
           sd <- sd[subscripts]
           panel.segments(as.numeric(x), y-sd, as.numeric(x), y+sd,
                          col="red", lwd=2)
           means <- Mean[subscripts]
           panel.text(as.numeric(x), rep(0.5, length(subscripts)),
                      paste("$", means, sep=""), cex=0.5)
         })

dev.off()
|
Copyright © Togaware Pty Ltd Support further development through the purchase of the PDF version of the book.