Togaware DATA MINING
Desktop Survival Guide
by Graham Williams
Google

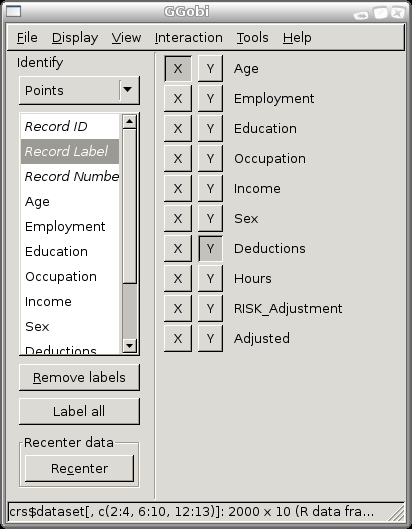
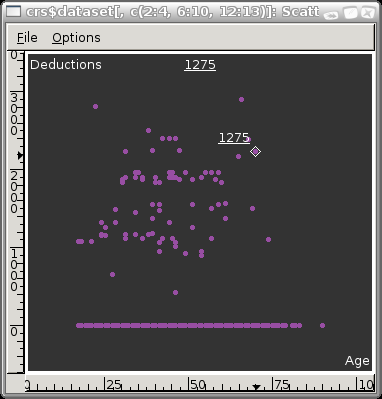
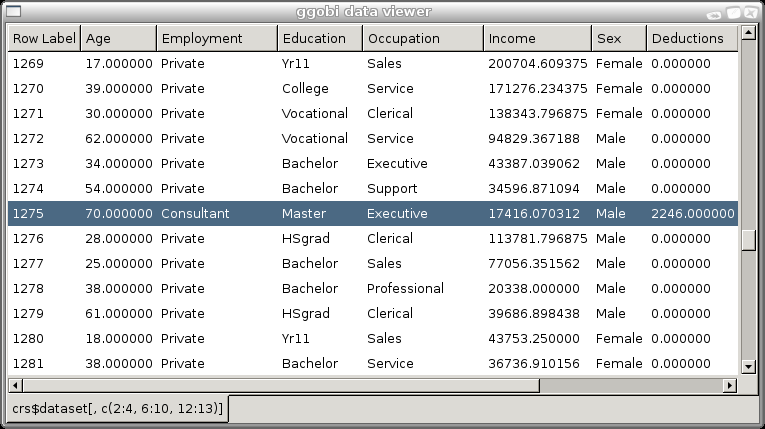
Data Viewer: Identifying Observations in Plots

Often we are interested in viewing the actual data/observations associated with points in our plots. The Tools menu provides many options and operations for visualising our data. In particular it provides access to a number of GGobi plugins. Some basic information about plugins is available from the Help menu, selecting the About Plugins item. The actual plugin we are interested in is the Data Viewer. Selecting this item from the Tools menu will display a textual view of the data, showing the row numbers and the column names, and allowing us to sort the rows by clicking on particular column names.

Image ggobi-dataview-control
To make most use of the Data Viewer we will want to use the Identify option available under the Interaction menu. This will change the Control window to display the Identify controls as shown here. The Data Viewer is then linked to the Plot, allowing us to select a particular row in the Data Viewer to have the corresponding observation identified in the current Plot. Similarly, we can mouse over the Plot to have the individual points identified (with their row number) as well as displaying to the observation within the Data Viewer. Within the Plot display we can also right mouse button a point to have it's row number remain within the plot (useful when printing to highlight particular points). The right mouse button on the same point will remove the row number display.

Image ggobi-dataview-plot Image ggobi-dataview-data

Copyright © Togaware Pty Ltd
Support further development through the purchase of the PDF version of the book.
The PDF version is a formatted comprehensive draft book (with over 800 pages).
Brought to you by Togaware. This page generated: Sunday, 22 August 2010