Desktop Survival Guide
by Graham Williams


|
DATA MINING
Desktop Survival Guide by Graham Williams |

|
|||
10 Fold Cross Validation |

library(ROCR)
data(ROCR.xval)
  pp <- ROCR.xval$predictions
  ll <- ROCR.xval$labels
  pred <- prediction(pp, ll)
  perf <- performance(pred, "tpr", "fpr")
pdf("graphics/rplot-rocr-10xfold.pdf")
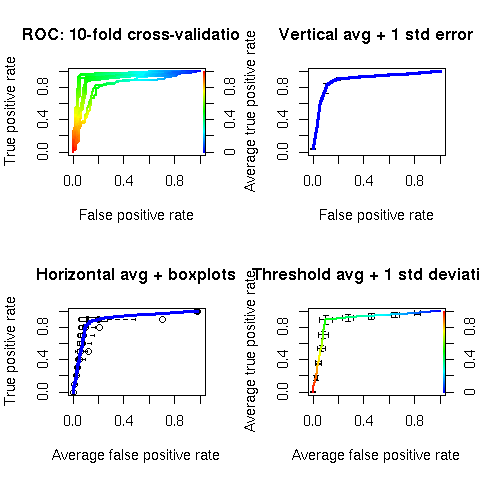
  par(mfrow = c(2, 2))
  plot(perf, colorize = T, lwd = 2,
       main = "ROC: 10-fold cross-validation")

  plot(perf, avg = "vertical", spread.estimate = "stderror",
       lwd = 3, main = "Vertical avg + 1 std error",
       col = "blue")

  plot(perf, avg = "horizontal", spread.estimate = "boxplot",
       lwd = 3, main = "Horizontal avg + boxplots",
       col = "blue")

  plot(perf, avg = "threshold", spread.estimate = "stddev",
       lwd = 2, main = "Threshold avg + 1 std deviation",
       colorize = T)
dev.off()
|