Desktop Survival Guide
by Graham Williams
|
|
DATA MINING
Desktop Survival Guide by Graham Williams |
|
|||
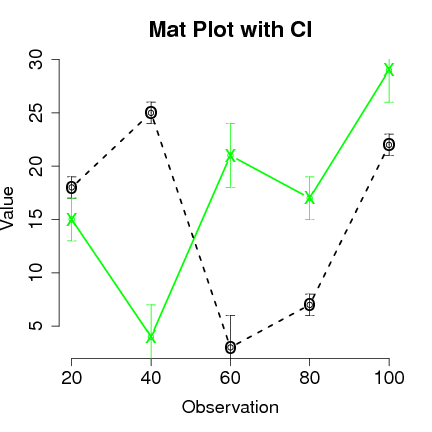
MatPlot |


|
This shows example using confidence intervals.
> library(plotrix)
> my.matrix <- matrix(sample(30,10),nrow=5,ncol=2)
> my.sample <- sample(3,10,replace=T)
> my.points <- seq(20,100,20)
> rownames(my.matrix) <- my.points
> colnames(my.matrix) <- letters[1:2]
> matplot(x=my.points, y=my.matrix,
      pch=c('x', 'o'), type = "b", lwd = 2, lty = c(1, 2),
      col = c("green", "black"),
      main = "Mat Plot with CI", xlab = "Observation", ylab = "Value",
      cex.main = 1.8, cex=2, cex.lab=1.5, cex.axis = 1.6, bty='n')
> plotCI(x=rep(my.points, 2), y= as.vector(my.matrix),
         uiw=my.sample,
         col=rep(c("green", "black"), each=nrow(my.matrix)),
         add=T)
|