Desktop Survival Guide
by Graham Williams


|
DATA MINING
Desktop Survival Guide by Graham Williams |

|
|||
Stairs Plot |
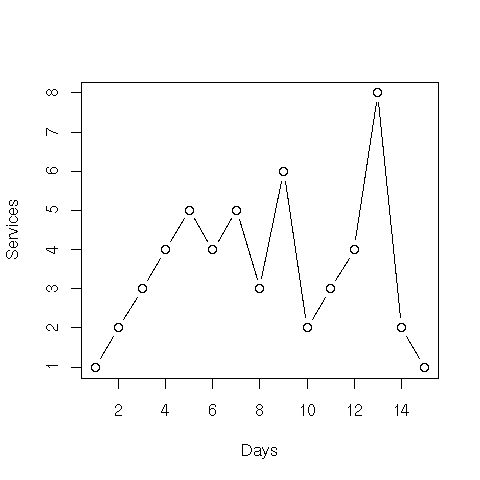
Another simple example plotting a sequence of numbers uses stairs (type="s") to give a city landscape type of plot.

pdf("graphics/rplot-line.pdf")
  l = c(1, 2, 3, 4, 5, 4, 5, 3, 6, 2, 3, 4, 8, 2, 1)
  plot(l, type="b", xlab="Days", ylab="Services")
dev.off()
|