Desktop Survival Guide
by Graham Williams


|
DATA MINING
Desktop Survival Guide by Graham Williams |

|
|||
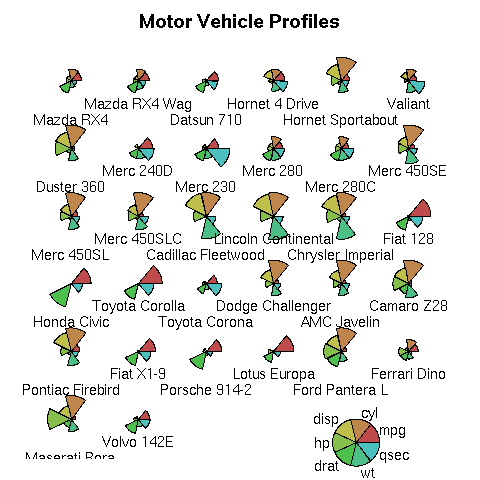
Star Plot |

# See http://zoonek2.free.fr/UNIX/48_R/04.html
pdf('graphics/rplot-stars.pdf')
  data(mtcars)
  palette(rainbow(12, s = 0.6, v = 0.75))
  stars(mtcars[, 1:7], len = 0.8, key.loc = c(12, 1.5),
        main = "Motor Vehicle Profiles", draw.segments = TRUE)
dev.off()
|