
Desktop Survival Guide
by Graham Williams
|
|
DATA MINING
Desktop Survival Guide by Graham Williams |
|
|||
Summarising Data |


|
While a picture might tell a thousand stories, textual summaries still
play an important roll in our understanding of data. We saw a basic
summary of our data after first loading the data into Rattle
(page ![[*]](crossref.png) ). The data types and the first
few values for each of the variables are automatically listed. This is
the most basic of summaries, and even so, begins to tell a story about
the data. It is the beginnings of understanding the data.
). The data types and the first
few values for each of the variables are automatically listed. This is
the most basic of summaries, and even so, begins to tell a story about
the data. It is the beginnings of understanding the data.
Rattle's Summary option of the Explore tab provides a number of more detailed textual summaries of our data.
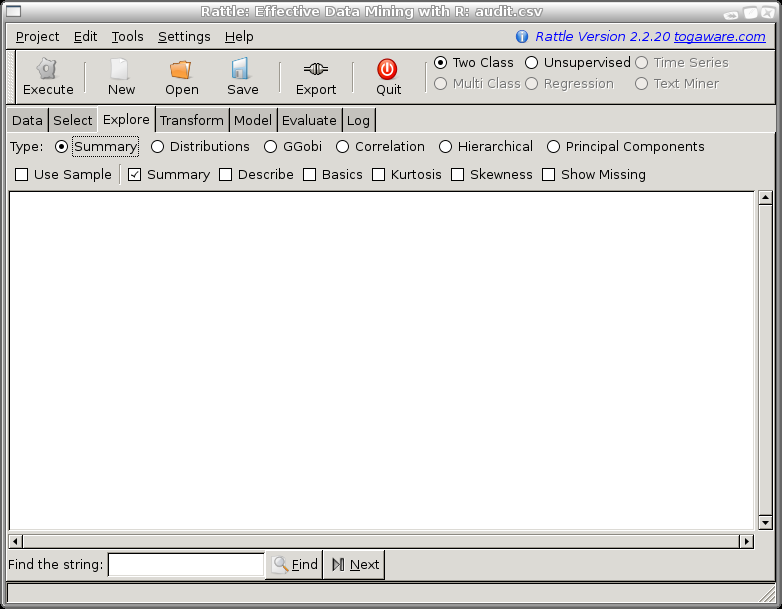
With the Use Sample check box we can choose to summarise the whole dataset, or just the training dataset. We might choose to only summarise the sample when the dataset itself is very large and the summaries take a long time to perform. We would usually not choose the sample option.
The rest of the check boxes of the Summary option allows us to fine tune what it is we wish to explore textually. We can choose to display one or many of the summary options. The first three--Summary, Describe, and Basic--are three alternatives that provide overall statistics for each variable (although the Basics option only summarises numeric variables). The final two, Kurtosis and Skewness provide specific measures of the characteristics of the data. These are separated out so that we can compare the kurtosis or skewness directly across a number of variables. These two measures both apply only to numeric data.