Desktop Survival Guide
by Graham Williams
|
|
DATA MINING
Desktop Survival Guide by Graham Williams |
|
|||
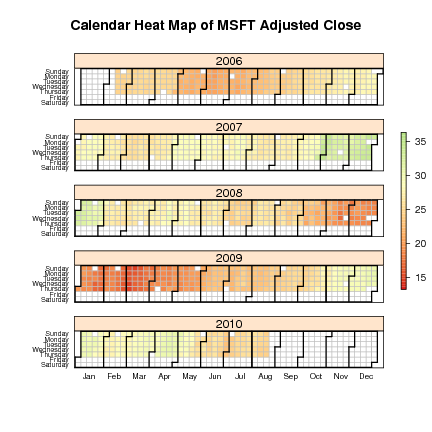
Time Series Heatmap |


|
091103 David Smith (REvolution) blogged about Paul Bleicher's (MD, PhD, Chief Medical Officer, Humedica) function that takes a sequence of numeric values indexed by date, and represents them as a calendar with the days filled with colors representing the values. The example uses Microsoft's stock price from 2006 to date from Yahoo. The financial data used here allows us to see weekend and holiday effects, and we able to see the daily, weekly, monthly and yearly closing prices quite effectively
The calendarHeat function takes two required arguments: Rarg[]dates is a vector of dates and Rarg[]values is a vector of numeric values. The dates can be in POSIXlt format or as characters, by default using the %Y-%m-%d format. This can be changed with the Rarg[]date.form argument. The values are converted into a scale of 99 (or Rarg[]ncolors) shades from red to green. We can control the color schemes with the Rarg[]colors argument. The argument colors="r2b" uses a red-to-blue scheme and colors="w2b" uses a white-to-blue scheme.
The function can be sourced from the blog:
> site <- "http://blog.revolution-computing.com" > path <- "downloads/calendarHeat.R" > source(file.path(site, path)) |
Here we download the Microsoft stock price from Yahoo! The data begins from 12 January 2006 to the present day.
> stock <- "MSFT"
> start.date <- "2006-01-12"
> end.date <- Sys.Date()
> quote <- paste("http://ichart.finance.yahoo.com/",
                 "table.csv?s=",
                 stock,
                 "&a=", substr(start.date,6,7),
                 "&b=", substr(start.date, 9, 10),
                 "&c=", substr(start.date, 1,4),
                 "&d=", substr(end.date,6,7),
                 "&e=", substr(end.date, 9, 10),
                 "&f=", substr(end.date, 1,4),
                 "&g=d&ignore=.csv", sep="")
> stock.data <- read.csv(quote, as.is=TRUE)
> calendarHeat(stock.data$Date, stock.data$Adj.Close,
               varname="MSFT Adjusted Close")
|