
Desktop Survival Guide
by Graham Williams
|
|
DATA MINING
Desktop Survival Guide by Graham Williams |
|
|||
Alternative Multiple Dot Plots |


|
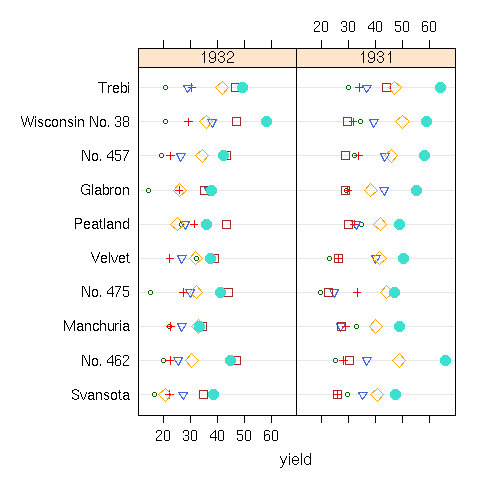
# Suggested by Sundar Dorai-Raj
library("lattice")
data(barley)
pdf("graphics/rplot-trellis-shapes.pdf")
  new.theme <- function()
  {
    theme <- col.whitebg()
    symb <- theme$superpose.symbol
    symb$cex <- seq(0.5, 1.5, length = length(symb$cex))
    theme$superpose.symbol <- symb
    theme
  }
  trellis.par.set(theme = new.theme())
  dotplot(variety ~ yield | year, data=barley, groups=site)
dev.off()
|