
Desktop Survival Guide
by Graham Williams
|
|
DATA MINING
Desktop Survival Guide by Graham Williams |
|
|||
Multiple Dot Plots |


|
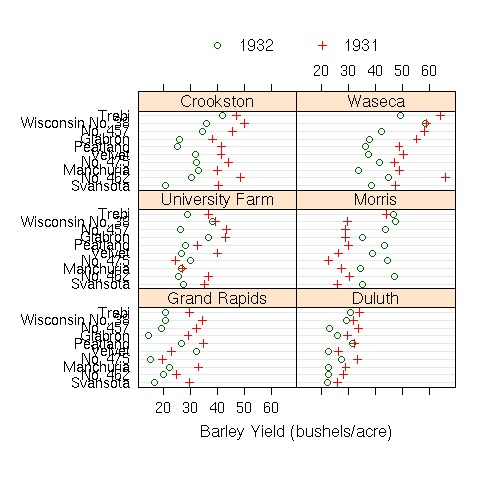
# Suggested by Michael Friendly
pdf("graphics/rplot-trellis.pdf")
  library(lattice)
  data(barley)
  n <- length(levels(barley$year))
  trellis.device(new = FALSE, theme = col.whitebg())
  dotplot(variety ~ yield | site,
    data = barley, groups = year,
    layout = c(2, 3), aspect = .5,
    xlab = "Barley Yield (bushels/acre)",
    key = list(points = Rows(trellis.par.get("superpose.symbol"),1:n),
    text = list(levels(barley$year)), columns = n))
dev.off()
|