Desktop Survival Guide
by Graham Williams
|
|
DATA MINING
Desktop Survival Guide by Graham Williams |
|
|||
Bar Chart Displays |


|
We illustrate some options in drawing bar charts from the lattice package. First a simple plot. We use NO_CONVERSION for r.data_frame so that the data frame retains the column names and for r.barchart so that the barchart can be printed to the device (otherwise it simply returns a data structure of the information).
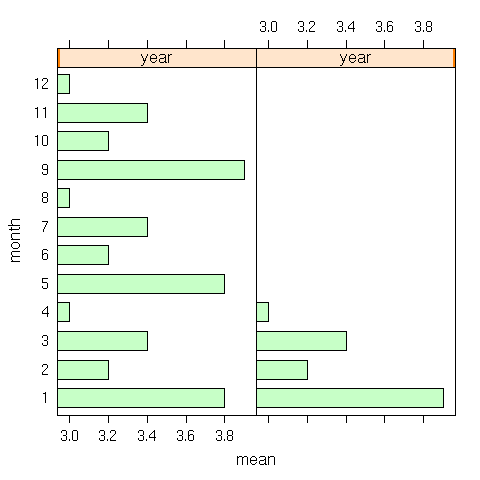
library("lattice")
pdf('graphics/rplot-bar-horizontal.pdf')
  dataset <- data.frame(month=c(1, 2, 3, 4, 5, 6, 7, 8, 9, 10, 11, 12,
                          1, 2, 3, 4),
                        year=c(2004, 2004, 2004, 2004, 2004, 2004, 2004, 2004,
                          2004, 2004, 2004, 2004, 2005, 2005, 2005, 2005),
                        mean=c(3.8, 3.2, 3.4, 3.0, 3.8, 3.2, 3.4, 3.0,
                          3.9, 3.2, 3.4, 3.0, 3.9, 3.2, 3.4, 3.0))
  trellis.par.set(theme=col.whitebg())
  barchart(month ~ mean | year, data=dataset)
dev.off()
|
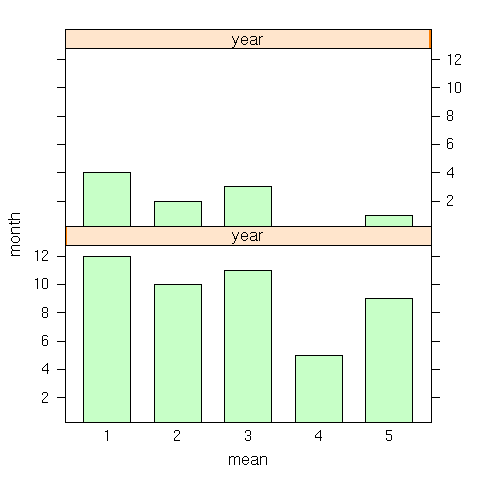
If we add horizontal = False, layout = (1,2) to the call to the r.barchart function, we can rotate the graphics: