Desktop Survival Guide
by Graham Williams


|
DATA MINING
Desktop Survival Guide by Graham Williams |

|
|||
Benford's Law |

The use of Benford's Law has proven to be effective in identifying oddities in data. For example, it has been used for sample selection in fraud detection. Benford's law relates to the frequency of occurrence of the first digit in a collection of numbers. In many cases, the digit `1' appears as the first digit of the numbers in the collection some 30% of the time, whilst the digit `9' appears as the first digit less than 5% of the time. This rather startling observation is certainly found, empirically, to hold in many collections of numbers, such as bank account balances, taxation refunds, stock prices, death rates, lengths of rivers, and process that a described by what are called power laws, which are common in nature. By plotting a collection of numbers against the expectation as based on Benford's law, we are able to quickly see any odd behaviour in the data.
Benford's law is not valid for all collections of numbers. For example, people's ages would not be expected to follow Benford's Law, nor would telephone numbers. So use the observations with care.
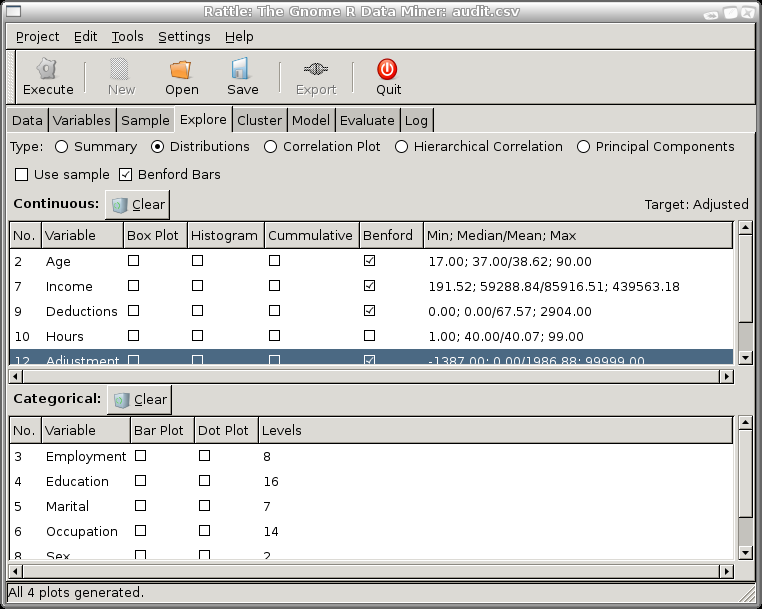
Some users find the bar chart presentation more readily conveys the information, whilst many prefer the less clutter and increased clarity of the line chart. However, a bar chart is useful if when you display a line chart you can not see all of the lines because they overlap. The bar chart will show all of the bars.
Regardless of which you prefer, Rattle will generate a single plot for each of the variables that have been selected for comparison with Benford's Law.
This particular exploration of Benford's Law leads to a number of
interesting observations. In the first instance, the variable ![]() clearly does not conform. As mentioned, age is not expected to conform
since it is a number series that is constrained in various ways. In
particular, people under the age of 20 are very much under-represented
in this dataset, and the proportion of people over 50 diminishes with
age.
clearly does not conform. As mentioned, age is not expected to conform
since it is a number series that is constrained in various ways. In
particular, people under the age of 20 are very much under-represented
in this dataset, and the proportion of people over 50 diminishes with
age.
The variable ![]() also looks particularly odd with numbers
beginning with `1' being way beyond expectations. In fact, numbers
beginning with `3' and beyond are very much under-represented,
although, interestingly, there is a small surge at `9'. There are good
reasons for this. In this dataset we know that people are claiming
deductions of less than $300, since this is a threshold in the tax
law below which less documentation is required to substantiate the
claims. The surge at `9' could be something to explore further,
thinking perhaps that clients committing fraud may be trying to push
their claims as high as possible (although there is really no need, in
such circumstances, to limit oneself, it would seem, to less than
$1000).
also looks particularly odd with numbers
beginning with `1' being way beyond expectations. In fact, numbers
beginning with `3' and beyond are very much under-represented,
although, interestingly, there is a small surge at `9'. There are good
reasons for this. In this dataset we know that people are claiming
deductions of less than $300, since this is a threshold in the tax
law below which less documentation is required to substantiate the
claims. The surge at `9' could be something to explore further,
thinking perhaps that clients committing fraud may be trying to push
their claims as high as possible (although there is really no need, in
such circumstances, to limit oneself, it would seem, to less than
$1000).
By exploring this single plot (i.e., without partitioning the data
according to whether the case was adjusted or not) we see that the
interesting behaviours we observed with relation to ![]() have
disappeared. This highlights a point that the approach of exploring
Benford's Law may be of most use in exploring the behaviours of
particular sub-populations.
have
disappeared. This highlights a point that the approach of exploring
Benford's Law may be of most use in exploring the behaviours of
particular sub-populations.
Note that even when no target is identified (in the Variables tab) and the user chooses to produce Benford Bars, a new plot will be generated for each variable, as the bar charts can otherwise become quite full.