
Desktop Survival Guide
by Graham Williams
|
|
DATA MINING
Desktop Survival Guide by Graham Williams |
|
|||
Exploring Distributions |


|
It is usually a good idea to review the distributions of the values of each of the variables in your dataset. The Distributions option allows you to visually explore the distributions for specific variables.
Using graphical tools to visually investigate the data's characteristics can help our understanding the data, in error correction, and in variable selection and variable transformation.
Graphical presentations are more effective for most people, and Rattle provides a graphical summary of the distribution of the data with the Distribution option of the Explore tab.
Visualising data has been an area of study within statistics for many years. A vast array of tools are available within R for presenting data visually and the topic is covered in detail in books in their own right, including () and Tufte.
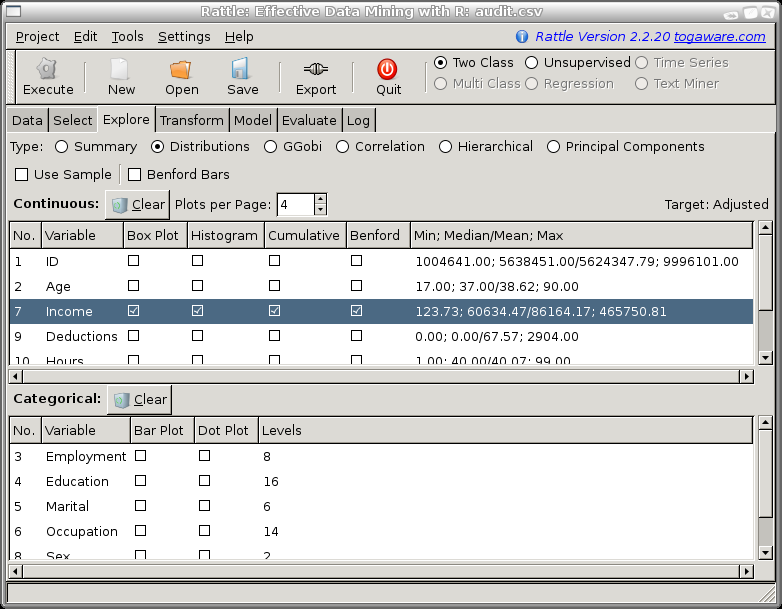
By choosing the Distributions radio button you can select specific variables of interest, and display various distribution plots. Selecting many variables will lead to many plots being displayed, and so it may be useful to display multiple plots per page (i.e., per window) by setting the appropriate value in the interface. By default, four plots will be displayed per page or window, but you can change this to anywhere from 1 plot per page to 9 plots per page. If we are actually generating fewer plots than our selected number of plots per page, then we will see that the plots will fill up the window rather than leaving empty places. Thus the Plots per Page is really a maximum number of plots per page.
The Annotate check box can be checked to obtain additional annotations on the plots. For a Box Plot, for example, this will add the actual numeric values for the median and quartiles.
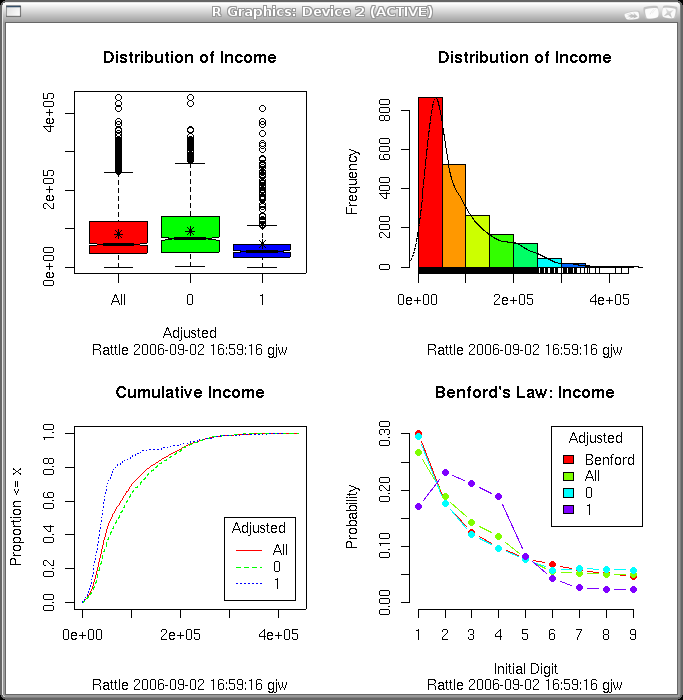
The box and whiskers plot identifies the median and mean of the variable, the spread from the first quartile to the third, and indicates the outliers. The histogram splits the range of values of the variable into segments and shows the number of entities in each segment. The cumulative plot shows the percentage of entities below any particular value of the variable. And the Benford's Law plot compares the distribution of the first digit of the numbers against that which is expected according to Benford's Law. Each of the plots shown here is explained in more detail in the following sections.
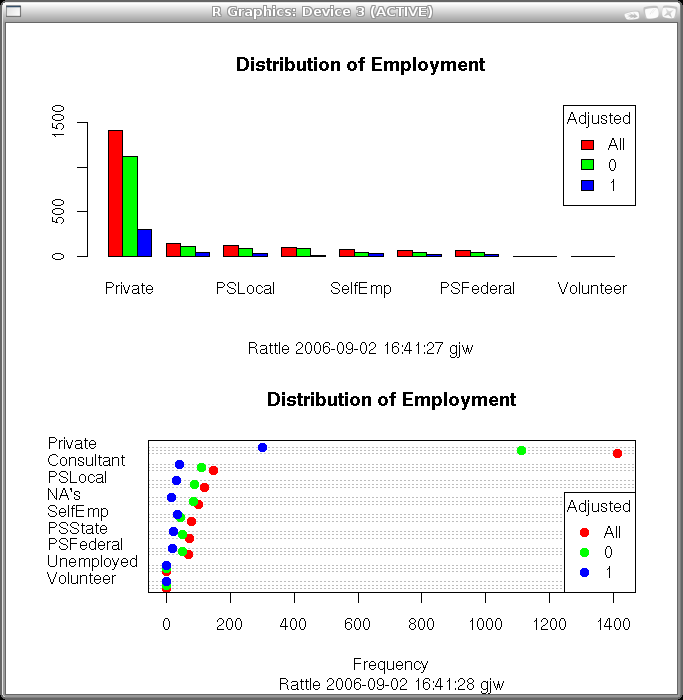
A bar plot uses vertical bars while the dot plot uses dots placed horizontally. The dot plot has more of a chance to list the actual values for the variable, whilst a bar plot will have trouble listing all of the values (as illustrated here). The mosaic plot is similar to the bar plot but each ``bar'' splits the values between the distinct values of the target variable (if one is chosen).
Each of the plots is explained in more detail in the following sections.