Desktop Survival Guide
by Graham Williams


|
DATA MINING
Desktop Survival Guide by Graham Williams |

|
|||
Boxplot |
See Section 32.7.2
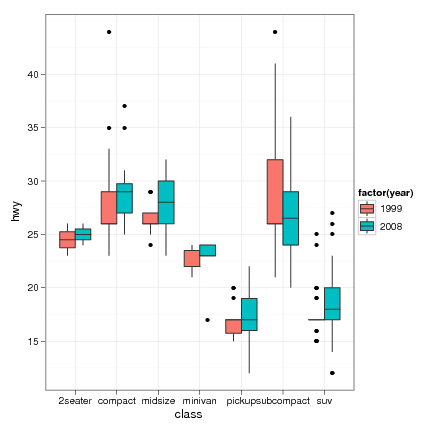
An example using ggplot2
> library(ggplot2)
> data(mpg)
> pl <- qplot(class, hwy, fill=factor(year), data=mpg, geom="boxplot", position="dodge") +
    theme_bw()
> print(pl)
|
