Desktop Survival Guide
by Graham Williams
|
|
DATA MINING
Desktop Survival Guide by Graham Williams |
|
|||
Boxplot Using ggplot |


|
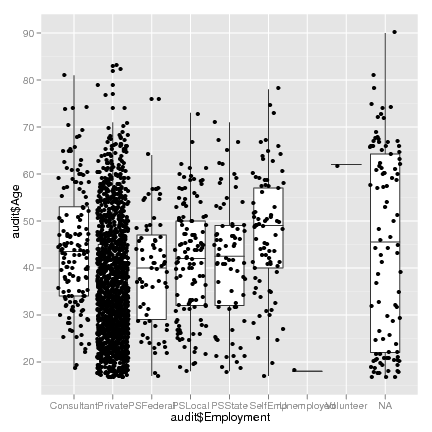
The ggplot package also provides functionality to display boxplots. The qplot function is a simple interface to generate one. Here we use the audit dataset to explore the distribution of Age against Education.
> library(ggplot2)
> library(rattle)
> pl <- qplot(audit$Employment, audit$Age, geom=c("boxplot", "jitter"))
> print(pl)
|