Desktop Survival Guide
by Graham Williams


|
DATA MINING
Desktop Survival Guide by Graham Williams |

|
|||
Labels Within Plots |
Sometimes we like to annotate a plot with labels (often with text labels). The text command allows us to place text at a specific location.
> text(2, 4, "Label Centred at (2,4)", col="blue", font=2) |
Rarg[col=] Rarg[font=] This places the supplied text centred at the (x, y) position of (2, 4). We illustrate a number of common arguments, setting the text colour to be blue, and the font to be bold.
We often need to identify points within the plot where it is convenient to place the test. To find the locations the function locator is useful. Running the function will allow us to mouse click (using the left or first mouse button) on a plot at the points we wish to locate. You will hear a beep for each click. Finish the process with a right mouse click or pressing the ESC key (depending on the type of graphic device). A list of x and y points will be returned by the function.
The TkIdentify function of the TeachingDemos package can also be useful to assist in manually placing labels
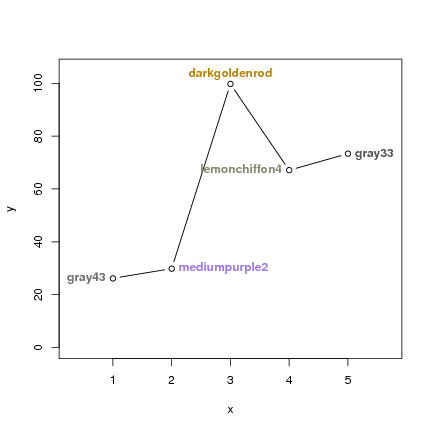
For automatic placement of labels the thigmophobe.labels function from the plotrix package can be used. This function will place labels within a plot so that the labels do not overlap. The supporting function thigmophobe determines which side of the supplied points is furthest from the next closest point. The thigmophobe.labels function then uses that tell the text function the Rarg[]pos= positions. This generally works well for label placement but there is no guarantee that the labels will not overlap.
> library(plotrix) > set.seed(143842) > n <- 5 > x <- 1:n > y <- runif(n, 1, 100) > plot(x, y, xlim=c(0.3, n+0.7), ylim=c(0, 105), type="b") > cols <- colours()[runif(n, 1, 600)] > thigmophobe.labels(x, y, cols, col=cols, font=2) |

Copyright © Togaware Pty Ltd Support further development through the purchase of the PDF version of the book.