Desktop Survival Guide
by Graham Williams


|
DATA MINING
Desktop Survival Guide by Graham Williams |

|
|||
Maths in Labels |
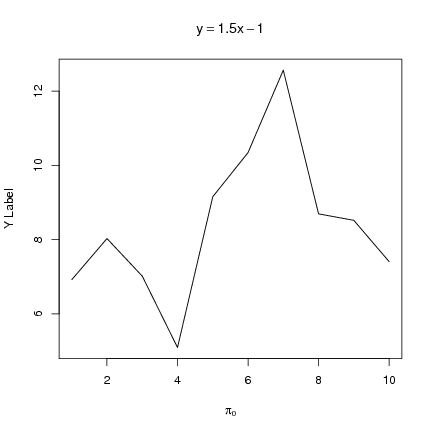
A large collection of mathematical symbols are available for adding to plots.
> plot(1:10, 1.5*runif(10, 1, 10)-1, ylab="Y Label", type="l",
       main=expression( y==1.5*x-1), xlab=expression(pi[0]))
|
