
Desktop Survival Guide
by Graham Williams
|
|
DATA MINING
Desktop Survival Guide by Graham Williams |
|
|||
Multiple Plots |


|
Place three plots on a single plot with layout
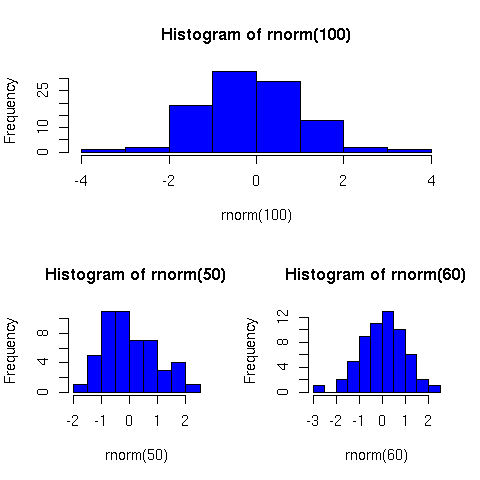
pdf("graphics/rplot-multi-hist.pdf")
layout(matrix(c(1, 1, 2, 3), 2, 2, byrow = TRUE))
hist(rnorm(100),col='blue')
hist(rnorm(50),col='blue')
hist(rnorm(60),col='blue')
dev.off()
|