
Desktop Survival Guide
by Graham Williams
|
|
DATA MINING
Desktop Survival Guide by Graham Williams |
|
|||
Plot Time Series |


|
This example creates a time series dataset recording two observations at each time step. The date and times are converted to chron objects, and then a zoo series is created, which is then plotted.
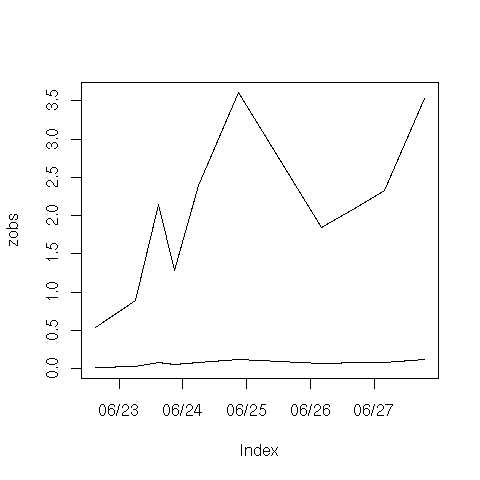
year <- c(rep(2005,10))
doy  <- c(rep(173,5), rep(174,5))
time <- c(15,30,45,100,115,15,30,45,100,115)
obs1 <- c(0.022128,0.035036,0.051632,0.071916,0.081136,
          0.07837,0.083902,0.126314,0.080214,0.117094)
obs2 <- c(0.533074667,0.887982667,1.284938,1.845450333,2.145839333,
          2.145126667,2.392422,3.60253,2.330776333,3.5277)
obs  <- cbind(year, doy, time, obs1, obs2)
|
library(chron) library(zoo) datetimes <- chron(paste(1, 1, obs[,1], sep="/"), obs[,3]/24) + obs[,2] - 1 zobs <- zoo(obs[,4:5], datetimes) plot(zobs, plot.type = "single") |