Desktop Survival Guide
by Graham Williams


|
DATA MINING
Desktop Survival Guide by Graham Williams |

|
|||
Plot Time Series with Axis Labels |
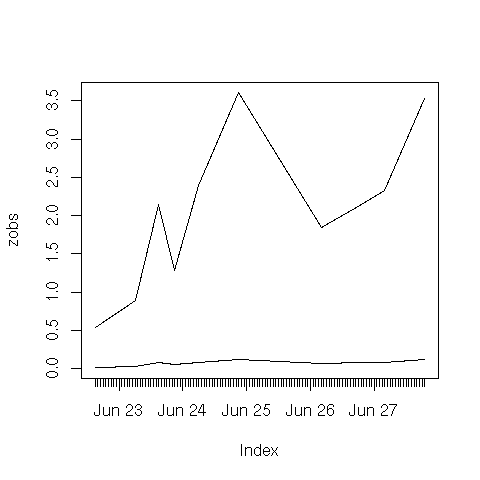
With the same data as previously, here we control the axis labels. We
tell the plot not to include axes (xaxt="n"). Then we add days
to the x axis, and then we add tick marks for the hours within the day.

plot(zobs, plot.type="single", xaxt="n") days <- seq(min(floor(datetimes)), max(floor(datetimes))) axis(1, days, format(as.Date(days), "%b %d"), tcl=-0.6) hours <- seq(min(datetimes), max(datetimes), by=1/24) axis(1, hours, FALSE, tcl=-0.4) |