Desktop Survival Guide
by Graham Williams


|
DATA MINING
Desktop Survival Guide by Graham Williams |

|
|||
Separate Line Plots |
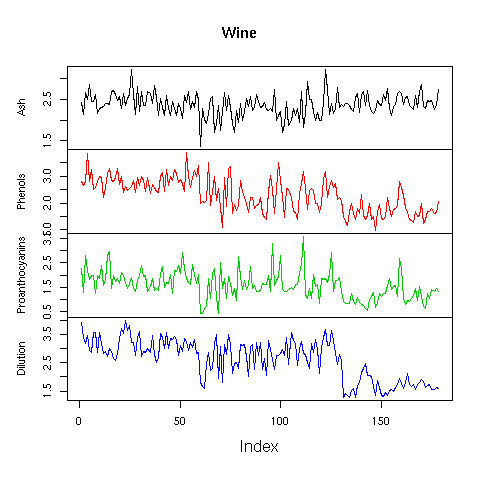
The multiple line plots can be separated into their own plots, stacked vertically, to give a clearer view of the individual plots. We can use the zoo package to plot sequences. These plots are especially useful for data that is sequence oriented, such as time series plots, but even here we can get some insights into the data.

library(zoo)
load("wine.Rdata")
cols <- c("Ash", "Phenols", "Proanthocyanins", "Dilution")
zdat <- zoo(wine[,cols], 1:nrow(wine))
plot(zdat, main="Wine", col=1:4)
|