Togaware
  • Graham’s Blog
  • Data Science
  • One Page R
  • Rattle
  • GNU/Linux
  • LaTeX
  • EcoSysl
  • More
    • Bookshelf
    • Freedom
    • References
    • Togaware
    • REST
  • About
    • Graham Williams
    • Short Bio
    • Bio
    • Presentations
    • Publications
  • Graham’s Blog
  • Data Science
  • One Page R
  • Rattle
  • GNU/Linux
  • LaTeX
  • EcoSysl
  • More
    • Bookshelf
    • Freedom
    • References
    • Togaware
    • REST
  • About
    • Graham Williams
    • Short Bio
    • Bio
    • Presentations
    • Publications
  • Home
  • Rattle
  • Rattle 3.1.0 Released

Rattle 3.1.0 Released

20 July 2014 Written by Graham Williams

Rattle 3.1.0 is now available on CRAN. This represents ongoing bug fixes and functionality improvements.

Specific updates include:

  • Numerous updates of plots to use ggplot2 rather than base graphics: ROC curves, riskchart, box plots, histogram plots, pairs plot, Benfords. Advanced Graphics is now the default, reverting to tradition graphics where needed. The migration to ggplot2 is ongoing.
  • Added new Benfords functionality.
  • Added a rescale option to kmeans.
  • New psfchart() for evaluation.
  • New function normVarNames() to normalise variable names to a standard preferred style.
  • Evaluate -> Error Matrix has been updated to report averaged class error and to report class errors.
  • Evaluate -< PrvOb plot bug fix for non-missing data.
  • INSTALL: Remove old INSTALL file – visit rattle.togaware.com for installation instructions.
  • plotNetwork() has been removed – not used by Rattle and generally of limited use. See onepager.togaware.com for the code.
  • No longer report repository revision number in version or about.
  • Miscellaneous bug fixes and stability improvements.
  • weatherAUS dataset is up-to-date.

Display a pairs plot under the Explore tab, choosing the Distributions option, and clicking Execute.

Screenshot from 2014-07-20 09:30:43

Click the CheckBox for BoxPlot of MinTemp.

Screenshot from 2014-07-20 09:51:55

On the Model tab, choose the Decision Tree option, then Execute, then the Draw button.

Screenshot from 2014-07-20 09:52:37

On the Evaluate tab, choose the Risk Chart option to evaluate the performance of the classification model.

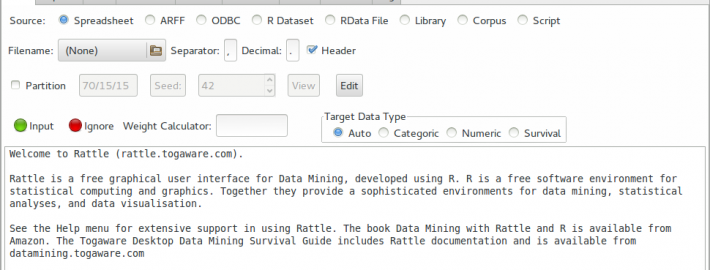
Screenshot from 2014-07-20 09:52:09

Rattle
Welcome to Togaware – Resources for the Data Scientist
Introducing Usama Fayyad – Big Data Summit 2014

Recent Posts

  • Rattle 5.1 Released
  • Setting up R for ML Tutorial
  • The Essentials of Data Science
  • Open Source R on the Azure Ubuntu Data Science Virtual Machine
  • Running an R Workshop on Azure with the Ubuntu Data Science Virtual Machine

Archives

  • September 2017
  • August 2017
  • May 2017
  • December 2016
  • November 2016
  • September 2016
  • July 2016
  • November 2015
  • October 2015
  • September 2015
  • November 2014
  • July 2014
  • April 2014

Tags

analytics analytics space australian connect-r data import data science ensembles extreme ensembles feature requests ggplot2 ggraptr government graml grammar of machine learning information builders introductions leaflet linux massively distributed models mchine learning Microsoft R Server model export open source open street map privacy R raptr rattle rexer r software rstat r_software sas shiny spss video virtual machine web site

Meta

  • Log in
  • Entries feed
  • Comments feed
  • WordPress.org

evolve theme by Theme4Press  •  Powered by WordPress  •  © Togaware Pty Ltd