Rattle, an open source GUI For Data Science and Machine Learning using R, has been updated to Version 5.1 on CRAN and is available for download now. As always, the latest updates to Rattle are available from  bitbucket.

A small but important update means that Rattle now works with the latest version of RGtk2 on CRAN.

A significant update is that the default boosting algorithm in Rattle is now xgboost, currently the most popular ensemble tree builder and a regular star performer with Kaggle. Rattle allows you to quickly get up to speed with using xgboost through the GUI and the automatically generated R code template.

Also with this release Rattle supports ggraptR for interactive generation of ggplot graphics. This requires the latest version or ggraptR available from github.

The Log tab continues to evolve to produce better R template code that is well written and documented, using the tidyverse functionality. This continues to improve and aims to follow the guidelines in my recent template-oriented book, Essentials of Data Science, in R

I have also made a Docker image available so that anyone can run Rattle without any installation required (except for installing Docker and loading up a copy of the image). This is available from the Docker Hub where you can also find instructions for setting up Docker. Indeed, check out my recent blog post on three options for setting up Rattle, including the use of the cloud-based Data Science Virtual Machine on Azure.

To install the latest release of Rattle from CRAN:

> install.packages("rattle")


Preparation

For our Machine Learning in R tutorial each participant is requested to install or obtain access to the free (as in libre) and open source software R and Rattle. Please complete this prior to the session itself or else let me know of any issues you have installing. An Azure (cloud) Data Science Virtual Machine running Ubuntu and a full suite of open source software for the data scientist will be available. The only setup required to use this setup is installing an application (X2Go) on your own computer to connect to the remote desktop. To run R and Rattle on your own computer you can install the open source Docker software and within a container running on your own computer you can run an image of Ubuntu already installed and configured with R and Rattle. This requires minimal setup and ensures everyone has the same experience. Finally you can install R and Rattle on your own computer together with a collection of over 200 support packages that are used through Rattle. This requires an hour or so downloading the required software packages.

We will describe each scenario below. Prior to the tutorial session it is requested that all participants aim to have a standalone and self contained environment running the pre-built Docker image. You are also requested to install the X2Go client locally (which requires an Internet connection during the tutorial to be useful). For a complete experience you can also install R locally prior to the tutorial session. This will ensure a smoother ramp up at the tutorial itself.

For each scenario on Mac OS X, you will also need to install XQuartz to display the Rattle Graphical User Interface.

WiFi is available for free through the Wireless@SG network.

Azure Data Science Virtual Machine

This is perhaps the simplest approach requiring only that you install the X2Go client on your own machine, under MS/Windows, Apple/OS X or GNU/Linux. It is also how many data scientists today work, allowing the cost-effective utilisation of cloud based servers of any size as required. We do require an Internet connection during the tutorial session for this approach to be useful and this can sometimes be problematic if relying on externally provided WiFi. Participants will receive a username and password to connect to a Ubuntu based Data Science Virtual Machine running on Azure. You will also be provided with the host name of the server to which to connect. All participants will then use the same configured environment and no further setup is required on your part. Following the tutorial session you can sign up for a free trial subscription to Azure (or use your own company’s subscription) to deploy your own data science virtual machine in the cloud.

The steps are: Install X2Go client; Fire up X2Go and configure it with the host name and user name to connect to the Data Science Virtual Machine desktop, choosing XFCE for the desktop type.

Docker Image

Docker is a lightweight alternative to a virtual machine with many of the same advantages. It can readily be installed on your own computer and this will then allow you to download an already configured image of the Ubuntu server with R and Rattle already installed. You can then run this image within a protected container on your own computer without any ongoing need for an Internet connection. Installation and deployment of the image is straight forward and described on Docker hub.

The steps are: Install Docker, download the Rattle image from the Docker Hub, run the Rattle image in a container.

 Local Install

This is the trickiest as everyone’s environment is different and the install can sometimes be problematic. It has the advantage that you then run R and Rattle locally in your computer’s own environment and do not require an Internet connection once installed. You begin by installing R. Then start up R and install Rattle:

$ R
> install.packages("rattle", dependencies=c("Depends", "Imports",  "Suggests"))

Further instructions are available from Togaware.

Getting Started with Rattle

For any of the above you will, once you have the software installed and a connection to the appropriate server/image/machine, start up R and then load the Rattle software.

$ R
> library(rattle)
> rattle()

A GUI should popup. Click on Execute, then on OK on the “load weather dataset” dialogue, then the Model tab, then Execute. You will have built your first machine learning model. Click on Draw to visualise the model.

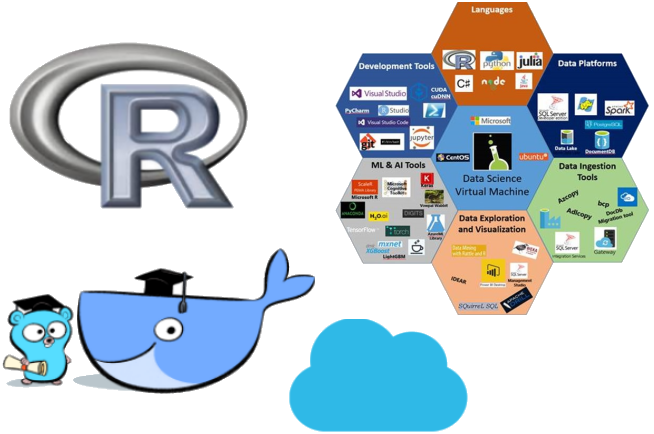
The fully open source software stack of the Ubuntu Data Science Virtual Machine (DSVM) hosted on Azure is a great place to support an R workshop or laboratory session or R training. I record  here the simple steps to set up a Linux Data Science Virtual Machine (in the main so I can remember how to do it each time).  Workshop attendees will have their own laptop computers and can certainly install R themselves but with the Ubuntu Data Science Virtual Machine we have a shared and uniformly configured platform which avoids the traditional idiosyncrasies and frustrations that plague a large class installing software on multiple platforms themselves. Instead of speding the first trouble filled hour of a class setting up everyone’s computer we can use a local browser to access either Jupyter Notebooks or RStudio Server running on the DSVM.

Jupyter Notebooks on JupyterHub

We illustrate the session with both Jupyter Notebook supporting multiple users under JupyterHub and as a backup running RStudio Server (for those environments where a secure connection through https is not permitted). Both can be accessed via browsers. JupyterHub uses https (encrypted) which may be blocked by firewalls within organisations. In that case an RStudio Server over http is presented as a backup.

WARNING: Jupyter Notebook has been able to render my laptop computer (under both Linux and Windows, Firefox and IE) unusable after a period of extensive usage when the browser freezes and the machine becomes completely unresponsive.

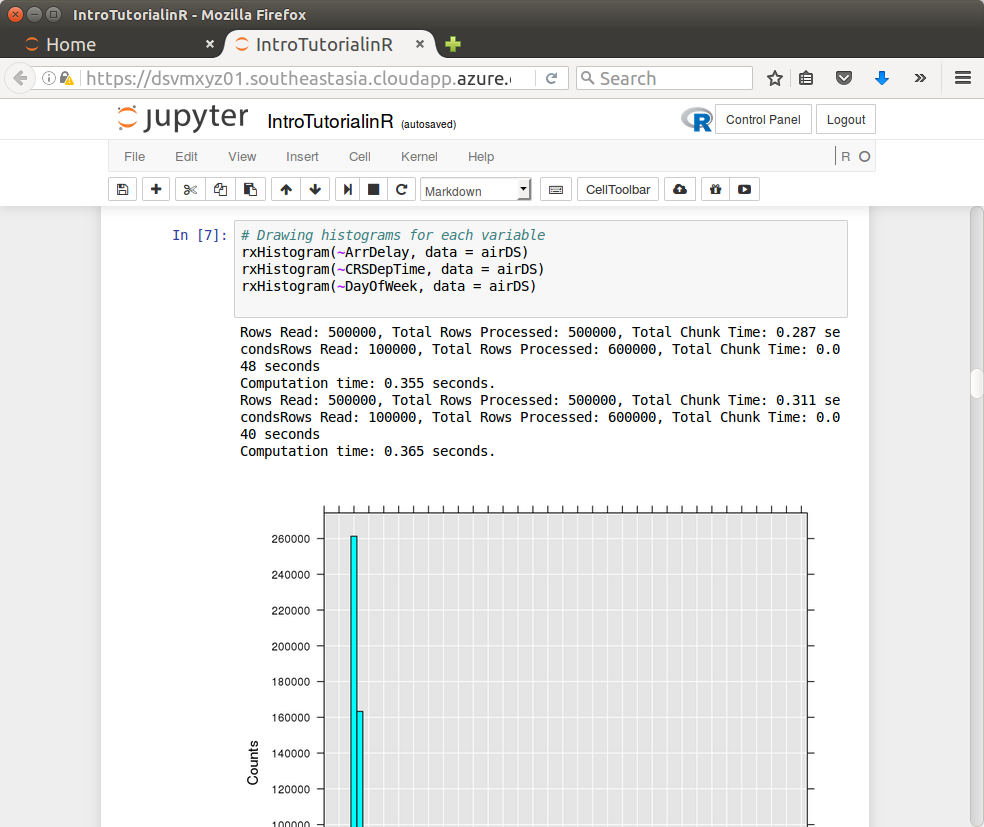
Jupyter Notebook provides a browser interface with basic literate programming capability. I’ve been a fan of literate programming since my early days as a programmer in the 1980’s when I first came across the concept from Donald Knuth. I now encourage literate data science and it is a delight to see others engaged is urging this approach to data science. Jupyter Notebooks are great for self paced learning intermixing a narrative with actual R code. The R code can be executed in place with results displayed in place as the student works through the material. Jupyter Notebooks are not such a great development environment though. Other environments excel there.

JupyterHub supports multiple users on the one platform, each with their own R/Jupyter process. The Linux Data Science Virtual Machine running on Azure provides these open source environments out of the box.  Access to JupyterHub is through port 8000.

Getting Started – Create a Ubuntu Data Science Virtual Machine

To begin we need to deploy a Ubuntu Data Science Virtual Machine. See the first two steps on my blog post. A DS14 server (or D14_V2 for a SSD based server) having 16 cores and 112 GB of RAM seems a good size (about $40 per day).

We may want to add a disk for user home folders as they can sometimes get quite large during training. To do so follow the Azure instructions:

  1. In the Portal click in the virtual machine.
  2. Click on Disks and Attach New.
  3. Choose the Size. 1000GB is probably okay for a class of 100.
  4. Click OK (takes about 2 minutes).
  5. Now log in to the server through ssh:
    ssh xyz@dsvmxyz01.southeastasia.cloudapp.azure.com
  6. The disk is visible as /dev/sdd
    • $ dmesg | grep SCSI
  7. Format the disk
    • $ sudo fdisk /dev/sdd
    • Type
      • n (new partition)
      • p (primary)
      • <enter> (1)
      • <enter> (2048)
      • <enter> (last sector)
      • p (create partition)
      • w (write partition)
    • $ sudo mkfs -t ext4 /dev/sdd1
  8. Create a temporary mount point and mount
    • $ sudo mkdir /mnt/tmp
    • $ sudo mount /dev/sdd1 /mnt/tmp
    • $ mount | grep /sdd1
  9. We will use this disk to mount as /home by default, so set that up
    • Check how much disk is used for /home
      • $ sudo du -sh /home
    • Synchronise /home to the new disk
      • $ sudo rsync -avzh /home/ /mnt/tmp/
    • Identify the unique identifier for the disk
      • $ sudo -i blkid | grep sdd1
    • Tell the system to mount the new disk as /home
      • $ sudo emacs /etc/fstab
      • Add the following single line with the appropriate UUID
        UUID=f395b783-31da-4916-a3a9-8fb56fd7a068 /home ext4 defaults,nofail,discard 1 2
    • Now mount the new disk as /home
      • $ sudo mount /home
    • No longer need the temporary mount so unmount
      • $ sudo umount /mnt/tmp
    • Move to the new version of home and ensure ssh can access
      • $ cd ~
      • $ df -h .
      • $ sudo restorecon -r /home

Connecting to JupyterHub

If you set up a DNS name label dsvmxyz01 and the location is southeastasia then visit:

https://dsvmxyz01.southeastasia.cloudapp.azure.com:8000/

First time you connect to the site you will be presented with a warning from the browser that the connection is insecure. It is using a self signed certificate to assure the encryption between your browser and the server. That is fine though a little disconcerting. As the user you could simply click through to allow the connection and add an exception. This often involves clicking on Advanced and then Add Exception… and then Confirm Security Exception. It is safe to provide an exception for now. However, best to install a proper certificate!

Install a LetsEncrypt Certificate

We can instead install a free Let’s Encrypt certificate from letsencrypt to have a valid non-self-signed certificate. To do so we first need to allow connection through the https: port (443) through the Azure portal for the dsvm. Then log on to the server and do the following:

** TO BE UPDATED TO THE EQUIVALENT IN UBUNTU **
$ ssh xyz@dsvmxyz01.southeastasia.cloudapp.azure.com
$ sudo yum install epel-release
$ sudo yum install httpd mod_ssl python-certbot-apache
$ sudo emacs /etc/httpd/conf.d/ssl.conf
  Within the Virtual Host entry add
    ServerName xyz.southeastasia.cloudapp.azure.com
    # SSLProtocol all -SSLv2
    # SSLCipherSuite HIGH:MEDIUM:!aNULL:!MD5:!SEED:!IDEA
$ sudo systemctl restart httpd
$ sudo systemctl status httpd
$ sudo certbot --apache -d xyz@dsvmxyz01.southeastasia.cloudapp.azure.com
$ sudo systemctl start httpd

You should be able to connect now without the certificate warning.

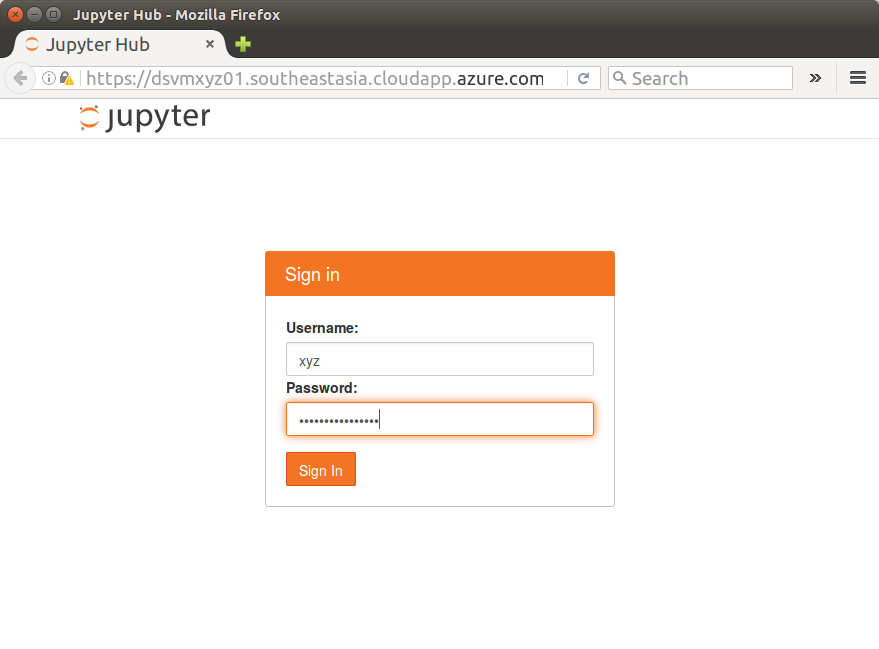
You are presented with a Jupyter Hub Sign in page.

Screenshot from 2016-07-29 09:14:41

Creating User Accounts

Log in to the server. This will depend on whether you set up a ssh-key or a username and password. We assume the latter for this post. On a terminal (or using Putty on Windows), connect as:

$ ssh xyz@dsvmxyz01.southeastasia.cloudapp.azure.com

You will be prompted for a password.

We can then create user accounts for each user in our workshop. The user accounts are created on the Linux DSVM. Here we create 40 user accounts and record their random usernames and passwords into the file usersinfo.csv on the server:

for i in {1..40}; do 
  u=`openssl rand -hex 2`
  sudo adduser user$u --gecos "" --disabled-password
  p=`openssl rand -hex 5`
  echo "user$u:$p" | sudo chpasswd
  echo user$u:$p >> 'usersinfo.csv'
done

If the process has issues and you need to start the account creation again then delete the users:

for i in $(cut -d ":" -f1 usersinfo.csv); do 
  sudo deluser --remove-home $i; 
done

# Check it has been done

tail /etc/passwd
ls /home/

Provide a username/passwd to each participant of the workshop, one line only to each user. The file will begin something like:

userce81:d0dfac5a30
userd2ec:a4f142c342
user6309:0f13aeb27a
user0774:e334399343

Now go back to https://dsvmxyz01.southeastasia.cloudapp.azure.com:8000/ and Sign in with the Username userce81 and Password d0dfac5a30 (using the username and password from your own usersinfo.csv file.)

Once logged in Jupyter will display a file browser.

screenshot-from-2016-10-04-200651

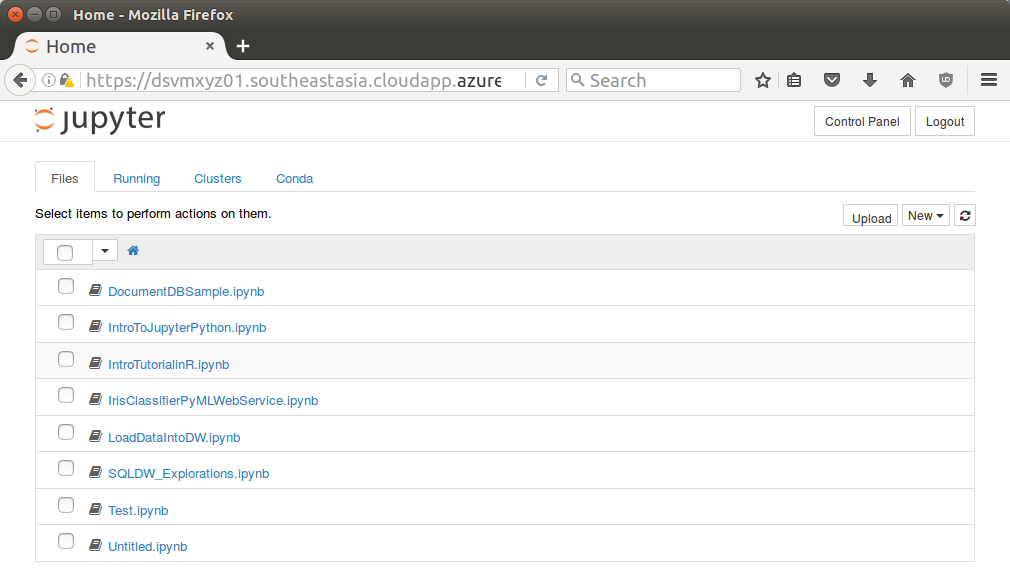
Notice a number of notebooks are available. Click the IntroTurorialInR.ipynb for a basic introduction to R.

Screenshot from 2016-07-29 09:15:49

Backup Option – RStudio

JupyterHub requires https and so won’t run internally within a customer site if they have a firewall blocking all SSL (encrypted) communications. In this case RStudio server is a backup option. It is pre-installed on the server and if you followed my instructions above for deploying a DSVM you will hav updated to the latest version too.

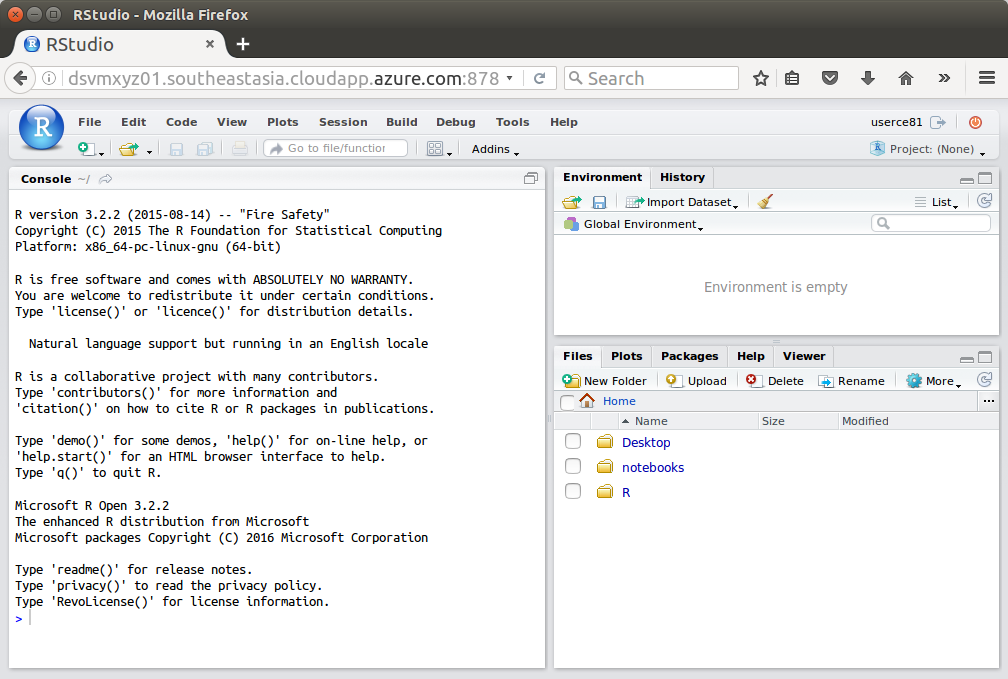
Connect to the RStudio server:

http://dsvmxyz01.southeastasia.cloudapp.azure.com:8787

Sign in to RStudio with the same Username and Password as above.

screenshot-from-2016-10-04-203025

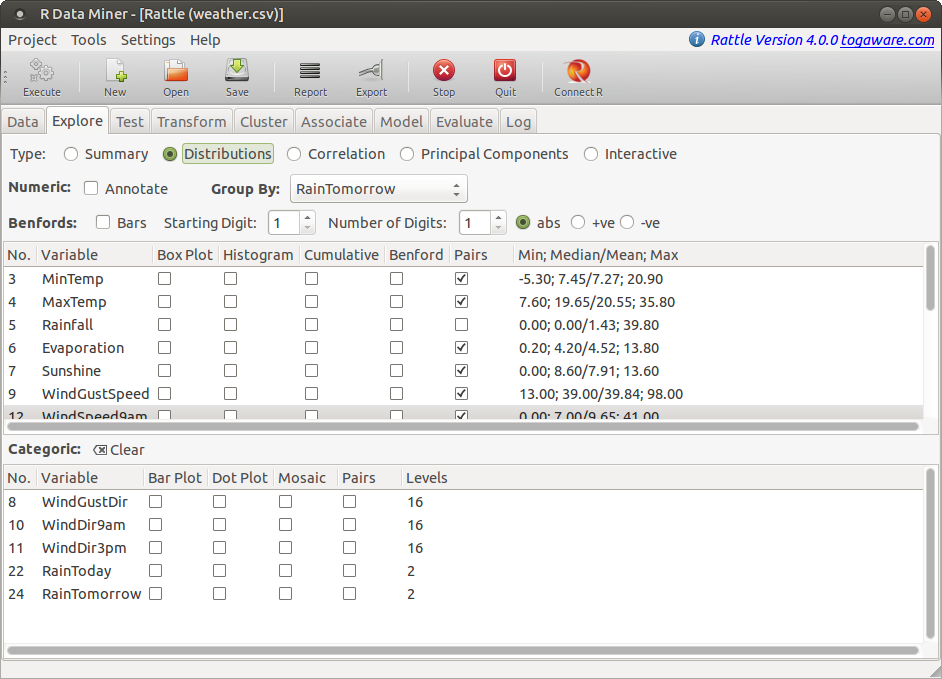
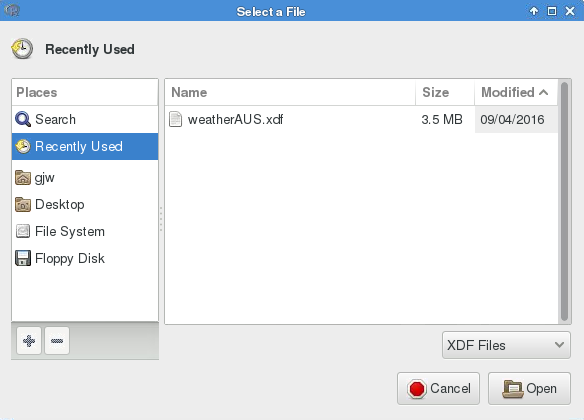
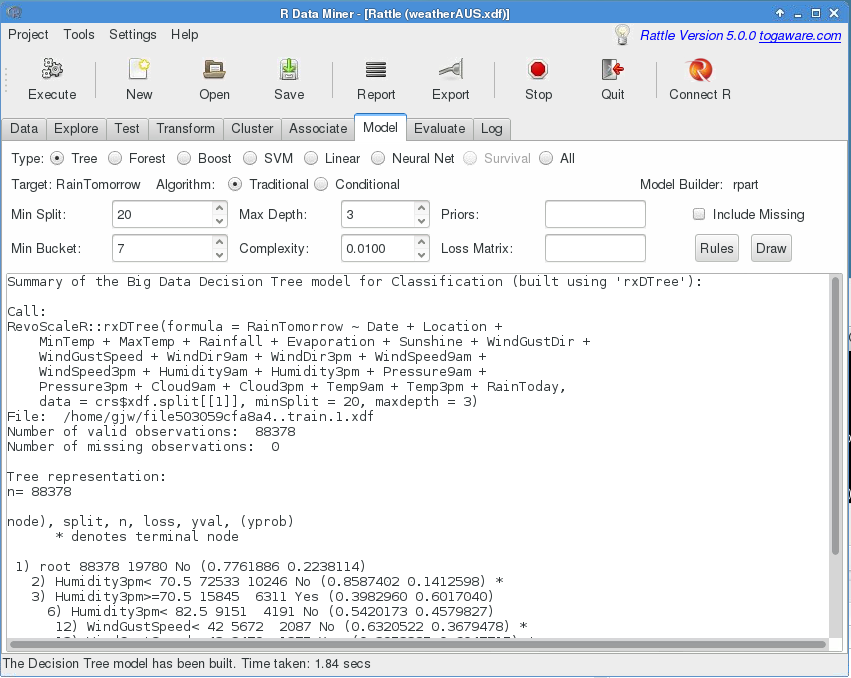
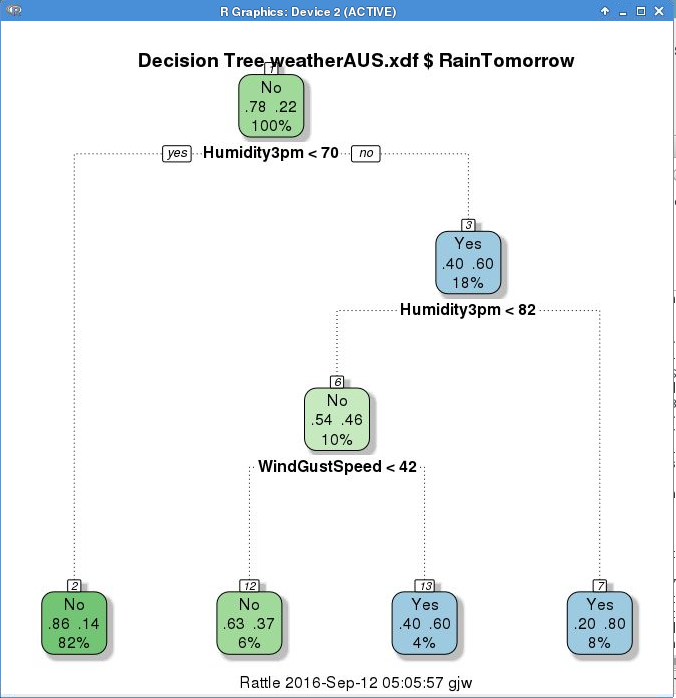
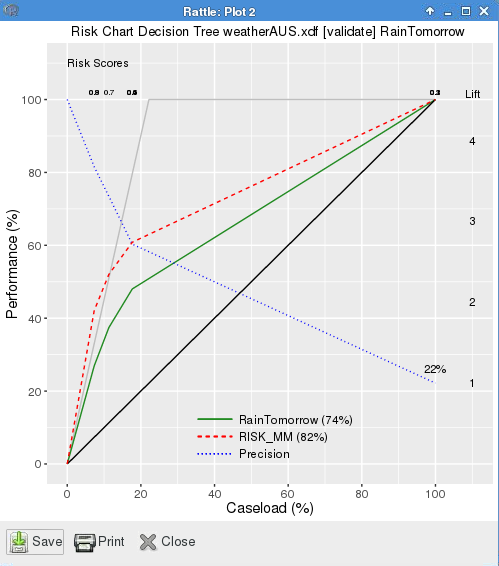
Running Rattle through an X2Go Desktop

If you followed my DSVM deployment guide then you will have also set up X2Go on your local computer to support a desktop connection across to the DSVM. This is very convenient in terms of running desktop apparitions, like Rattle,  on the DSVM. Every student in the class gets the same environment.

Shortcuts to the Services

The URLs are rather long and so we can set up either bit.ly or aka.ms shortcuts. Visiting the latter we set up two short URLs:

https://aka.ms/xyz_hub as https://dsvmxyz01.southeastasia.cloudapp.azure.com:8000
http://aka.ms/xyz_rstudio as http://dsvmxyz01.southeastasia.cloudapp.azure.com:878

We can now use the short URLs to refer to the long URLs.

REMEMBER: Deploy-Compute-Destroy for a cost effective hardware platform for Data Science. Deallocate (Stop) your server when it is not required.

Graham @ Microsoft

This was originally shared as a Revolution Analytics Blog Post on 25th October 2016.

Programming is an art and a way we express ourselves. As we write our programs we should keep in mind that someone else is very likely to be reading it. We can facilitate the accessibility of our programs through a clear presentation of the messages we are sharing.

As data scientists we also practice this art of programming. Indeed even more so we aim to share the narrative of our discoveries through our living and breathing of data through programming over the data. Writing programs so that others understand why and how we analysed our data is crucial. Data science is so much more than simply building black box analyses and models and we should be seeking to expose and share the process and particularly the knowledge that is discovered from the data.

Style is important in making the code we share readily accessible. Dictating a style to others is a sensitive issue. We thrive on our freedom to innovate and to express ourselves how we want but we also need consistency in how we do that and a style guide supports that. A style guide also helps us journey through a new language, providing a foundation for developing, over time, our own style in that language.

Through a style guide we share the tips and tricks for communicating clearly through our programs. We communicate through the language — a language that also happens to be executable by a computer. In this language we follow precisely specified syntax to develop sentences, paragraphs, and whole stories. Whilst there is infinite leeway in how we express ourselves in any language we can share a common set of principles as our style guide.

Over the years styles developed for very many different languages have evolved together with the medium for interacting with computers. I have a style guide for R that presents my personal and current choices. This is the style guide I suggest (even require) for projects I lead.

I hope the guide might be useful to others. It augments the other R style guides out there by providing the rationale for my choices. Irrespective of whether specific style suggestions suit you or not, choose your own and use them consistently. Do focus on communicating with others in the first instance and secondarily on the execution of your code (though critical it is).  Think of writing programs as writing narratives for others to read, to enjoy, to learn from and to build upon. It is a creative act to communicate well with our colleagues — be creative with style.

Hands On Data Science: Sharing R Code — With Style

The featured image comes from https://blog.codinghorror.com/new-programming-jargon/ where the concept of Egyptian Brackets is explained.

Graham @ Microsoft

I have released an alpha version of Rattle with two significant updates.

Eugene Dubossarsky and his team have been working on a Shiny interface to generate ggplot2  graphics interactively. It is a package called ggraptR. This is now available through Rattle’s Explore tab choosing the Interactive option.

screenshot-from-2016-09-12-124814

In line with Rattle’s philosophy of teaching programming of data by exposing all code through Rattle’s Log tab, ggraptR has a button to generate the plot. You can click the Generate Plot Code button, copy the resulting code and paste it into the R console, knitr document, or jupyter notebook. Execute the code and you generate the plot. Now you can start fine tuning it some more if you like.

The current alpha version has a few niggles that are being sorted out but it is already worth giving it a try.

The second major update is the initial support for Microsoft R Server so that Rattle can now handle datasets of any size. From Rattle’s Data tab choose an XDF file to load.

screenshot-from-2016-09-12-130305

A sample of the full (generally big) dataset will actually be loaded into memory but many of the usual operations will be performed on the XDF dataset on disk. For example, build a decision tree and Rattle will automatically choose rxDTree() for the XDF dataset instead of rpart().

screenshot-from-2016-09-12-130554

Visualise the tree as usual.

screenshot-from-2016-09-12-130617

Performance evaluation is also currently supported.

screenshot-from-2016-09-12-131401

Do check the Log tab to review the commands that were executed underneath.

This is an initial release. There’s still plenty of functionality to expose. Currently implemented for Binary Classification:

  • Data: Load xdf file;
  • Explore: Subset the dataset for interactive exploration;
  • Models: rxDTree, rxDforest;
  • Evaluate: Error Matrix, Risk Chart.

Still to come:

  • Data: Import CSV;
  • Models: boosting, neural network, svm.

You can try this new version out using either Microsoft R Client on MS/Windows or fire up an Azure Linux Data Science Virtual Machine which comes with the developer version of Microsoft R Server installed. Then upgrade the pre-installed Rattle to this new release.

> install.packages(c("rattle", "devtools"))
> devtools::install_bitbucket("kayontoga/rattle")

Graham @ Microsoft

The R package rattle provides a dataset that I have been collecting over a few years now from the Australian Bureau of Meteorology.  Like most of the datasets in rattle  it is also available as a CSV file as part of the package (as well as a proper R dataset) and can also be downloaded from the Internet at http://rattle.togaware.com/weatherAUS.csv

The dataset has been sourced from the bureau since about 2008 for nearly 50 weather stations, some of which we can see on the map below which comes from the bureau:

Graham @ Togaware

A new release of Rattle has hit CRAN – this is version 4.0.0 and brings a variety of stability fixes and enhancements. For example, Jose A Magaña has added support for the display of pairs plots.

Screenshot-Rattle: Plot 3

An obvious addition is the Connect-R button on the toolbar – this will take you to Connect-R where R related projects (including suggestions for enhancements to Rattle) can be listed and crow-funding applied to have the projects completed. Jose’s project to add pairs plots is an example of a crowd funded addition to Rattle.

Screenshot-R Data Miner - [Rattle (weather.csv)]-1

Other enhancements include

  • more migration of plots to using ggplot2,
  • multiple ggplot2 plots within the single window,
  • add Group By to override the default group by the target variable for plots,
  • use of pipes to build commands exposed within the Log tab,
  • support colour changes in fancyRpartPlot()
  • error matrix now supports multi-class targets
  • use readr::read_excel() to reduce Java reliance

Here’s a quite succinct yet comprehensive summary of machine learning algorithms produced by Jason Brownlee of Machine Learning Mastery. It includes a visual of the algorithms — though it does have a bit of a flavour of phishing for email addresses which is needed to download the graphic. The one below can be found without providing an email address but not as good quality.

A summary of the annual survey of tools and attitudes around data science conducted by Karl Rexer was released at Predictive Analytics World in Boston recently. The full report is expected to be available on RexerAnalytics.com in the next couple of months.

Screenshot-Rexer Data Science Survey Highlights Sep-2015.pdf - Adobe Reader

For primary tool usage:

#1 — 36.2% — R
#2 —   7.0% — SAS
#3 —   6.6% — IBM SPSS Modeler
#4 —   6.5% — KNIME (free version)
#5 (tie) — 5.1% — IBM SPSS Statistics
#5 (tie) — 5.1% — STATISTICA
#7 —   3.1% — SAS Enterpirse Miner
#8 —   2.8%  — RapidMiner (free version)
#9 —   2.7% — Weka
#10 — 2.3% — MATLAB

This is a nice example of the power of multiple APIs working together to deliver a solution.

The app uses R’s Shiny to control a map built using the open source JavaScript Leaflet based on public data displaying map tiles generated by  Stamen Design on Open Street Map data.

Thanks to colleague and R guru Hugh Parsonage for pointing to this one on twitter https://coolbutuseless.shinyapps.io/ActCrashesInvolvingBicycles.


Screenshot-Mozilla Firefox-1