The R package rattle provides a dataset that I have been collecting over a few years now from the Australian Bureau of Meteorology.  Like most of the datasets in rattle  it is also available as a CSV file as part of the package (as well as a proper R dataset) and can also be downloaded from the Internet at http://rattle.togaware.com/weatherAUS.csv

The dataset has been sourced from the bureau since about 2008 for nearly 50 weather stations, some of which we can see on the map below which comes from the bureau:

Graham @ Togaware

A new release of Rattle has hit CRAN – this is version 4.0.0 and brings a variety of stability fixes and enhancements. For example, Jose A Magaña has added support for the display of pairs plots.

Screenshot-Rattle: Plot 3

An obvious addition is the Connect-R button on the toolbar – this will take you to Connect-R where R related projects (including suggestions for enhancements to Rattle) can be listed and crow-funding applied to have the projects completed. Jose’s project to add pairs plots is an example of a crowd funded addition to Rattle.

Screenshot-R Data Miner - [Rattle (weather.csv)]-1

Other enhancements include

  • more migration of plots to using ggplot2,
  • multiple ggplot2 plots within the single window,
  • add Group By to override the default group by the target variable for plots,
  • use of pipes to build commands exposed within the Log tab,
  • support colour changes in fancyRpartPlot()
  • error matrix now supports multi-class targets
  • use readr::read_excel() to reduce Java reliance

Here’s a quite succinct yet comprehensive summary of machine learning algorithms produced by Jason Brownlee of Machine Learning Mastery. It includes a visual of the algorithms — though it does have a bit of a flavour of phishing for email addresses which is needed to download the graphic. The one below can be found without providing an email address but not as good quality.

A summary of the annual survey of tools and attitudes around data science conducted by Karl Rexer was released at Predictive Analytics World in Boston recently. The full report is expected to be available on RexerAnalytics.com in the next couple of months.

Screenshot-Rexer Data Science Survey Highlights Sep-2015.pdf - Adobe Reader

For primary tool usage:

#1 — 36.2% — R
#2 —   7.0% — SAS
#3 —   6.6% — IBM SPSS Modeler
#4 —   6.5% — KNIME (free version)
#5 (tie) — 5.1% — IBM SPSS Statistics
#5 (tie) — 5.1% — STATISTICA
#7 —   3.1% — SAS Enterpirse Miner
#8 —   2.8%  — RapidMiner (free version)
#9 —   2.7% — Weka
#10 — 2.3% — MATLAB

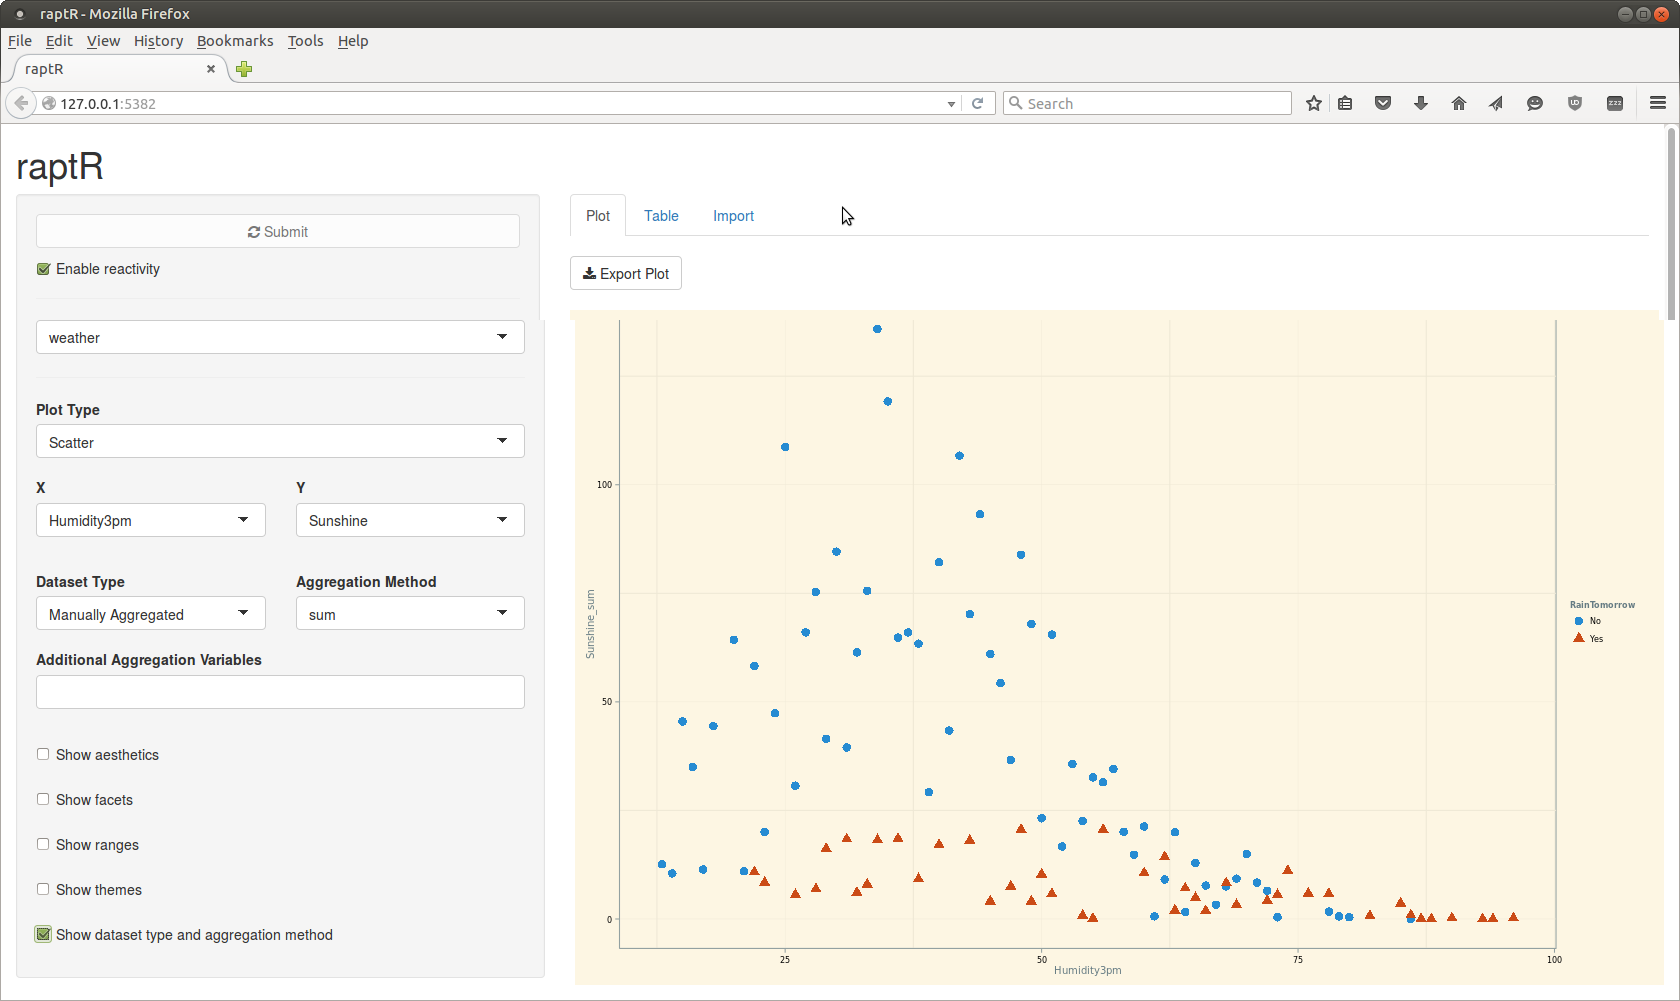
I saw a demo of a package for Rapid and Pretty Things in R earlier in the year when it was a work in progress. It is now live on GitHub (but not yet CRAN). It allows you to very quickly visualise data in R using a Shiny GUI to generate ggplot2 underneath. A nice app for some visual analytics.

devtools::install_github('cargomoose/raptR')
raptR::raptR()

Screenshot-raptR - Mozilla Firefox

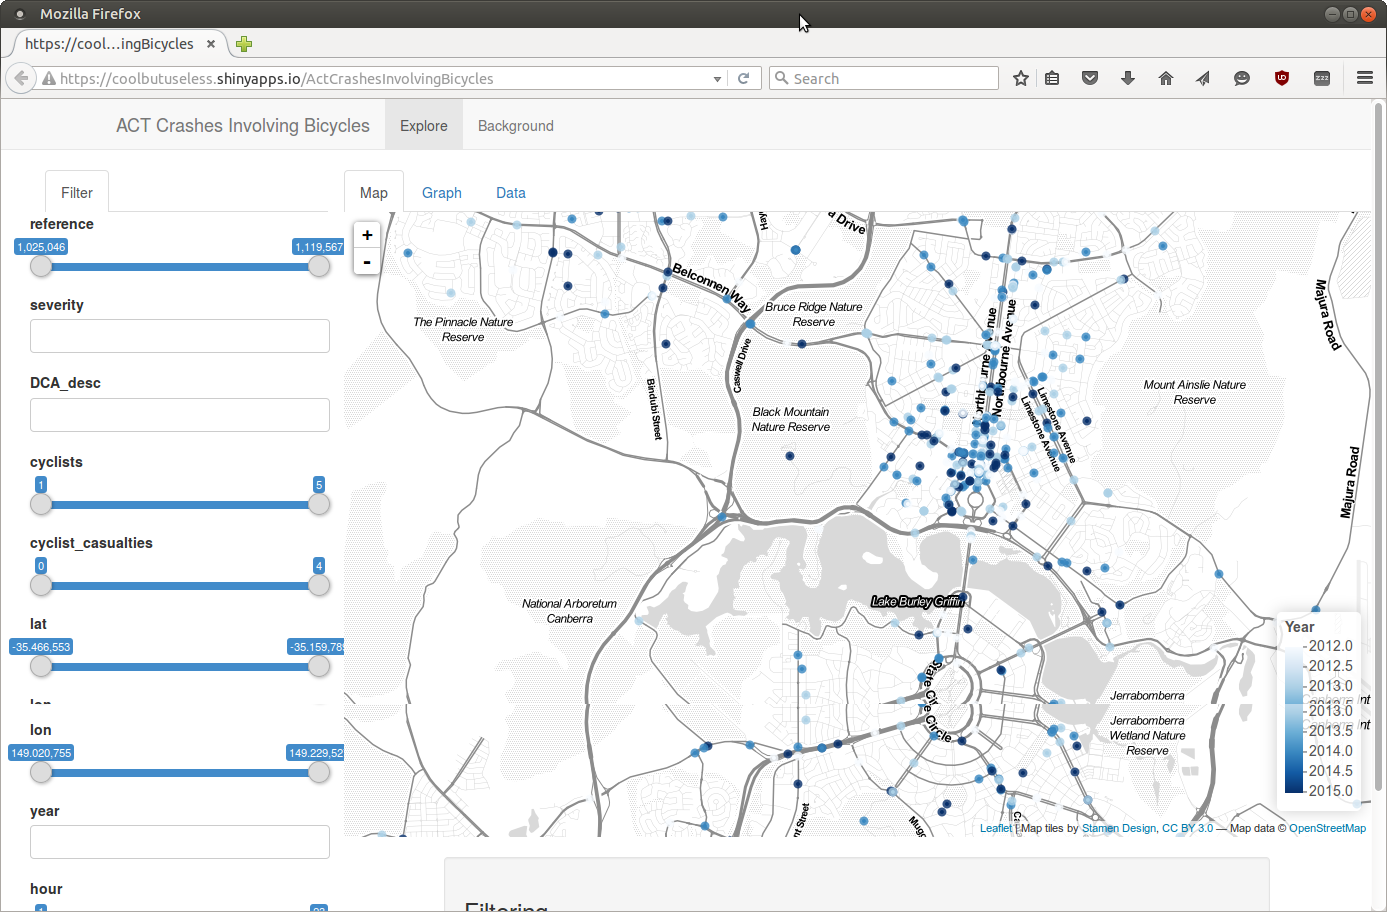
This is a nice example of the power of multiple APIs working together to deliver a solution.

The app uses R’s Shiny to control a map built using the open source JavaScript Leaflet based on public data displaying map tiles generated by  Stamen Design on Open Street Map data.

Thanks to colleague and R guru Hugh Parsonage for pointing to this one on twitter https://coolbutuseless.shinyapps.io/ActCrashesInvolvingBicycles.


Screenshot-Mozilla Firefox-1

I’ve had a few enquiries lately on the relationship between Rattle and the WebFOCUS predictive analytics component called RStat from Information Builders (WebFOCUS is their widely used Business Intelligence suite).

I even had an approach recently from an Australian company offering to provide a demonstration of RStat to see if it might be something we could use for our Data Mining.

Yes, RStat is a fork of Rattle. We developed the initial fork through Togaware back in 2008 or thereabouts. It is an extension to Rattle that allows direct integration into WebFOCUS. Those familiar with Rattle will recognise the following plots generated from RStat.

A WebFOCUS Business Intelligence user can launch RStat as an integrated component of the suite. That is a nice option and users can seamlessly deploy the power of R to do their predictive analytics.

One of the first benefits of the integration is that it allows data to be imported directly and seamlessly into RStat from WebFOCUS. The significance of this is that WebFOCUS has an admirable collection of data import modules and so data from pretty much any source can be integrated into WebFOCUS and thus into RStat (Rattle).

The other significant addition found in RStat is the ability to directly export R models as C code into WebFOCUS. These then become compilable C code modules and hence are first class WebFOCUS objects. These objects are then deployed within the WebFOCUS environment. Anyone familiar with the challenge of deploying R models (or Python models) into a production environment will recognise the significance of this functionality – models are automatically deployable into production without the recoding requirements we as Data Scientists often face.

Information Builders now maintain RStat. Also have a look at the RStat Fact Sheet for details.

Cheers

I’ve moved the hosting of the open source Rattle GUI for doing Data Mining with R onto bitbucket using git. Developers can now clone and modify and push requests.

Visit https://bitbucket.org/kayontoga/rattle

Connect-R is a relatively new service which acts as a market place for matching requests for improvements to R packages with developers who may be able to do so. There is also the option to crowd fund the development. I’ve started encouraging users of Rattle to add feature requests through Connect-R.

A number of new features have now been added to Rattle through the use of Connect-R with the developer receiving payment for so doing. The implementations were well done and I readily included them into the Rattle release code.

Welcome to the new togaware.com site. After over a year living on togaware.net I’ve finally moved the test site over to the main togaware.com site and this is what you are now viewing!

You’ll find all of the Togaware resources here still (somewhere or other…). They are being migrated across to the new format bit by bit. If you can’t find something do let me know (add a comment below). We’ll try an find it again!

Stay tune for more blog posts and new activities linked with Togaware.