23.5 Reference: Sample Sheets
We describe some of the sheets that are supplied
with dia. For each we list the collection of shapes
(objects) provided and give an example diagram made from the shapes.
The specification of each sheet is an XML document usually located in
/usr/share/dia/sheets/.
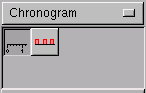
23.5.1 Chronogram
The Chronogram sheet contains just two shapes, but with
functionality that allows a considerable variety.
 %
%
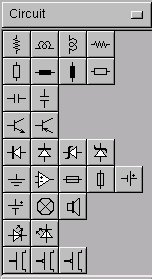
23.5.2 Circuit
The Circuit sheet contains shapes useful for drawing electrical
and electronic circuit diagrams. The sheet includes, in order, a
Vertical Resistor, Horizontal Inductor, Vertical Inductor, and a
Horizontal Resistor as the first row with their European counterparts
as the second row. Then Horizontal and Vertical Capacitors, npn and
pnp Bipolar Transistors, Horizontal and Vertical Diodes and Zener
Diodes, Ground Point, Operational Amplifier, Horizontal and Vertical
Fuses and Power Sources, Lamp, Speaker, Horizontal and Vertical LEDs,
NMOS and PMOS Transistors, and a Horizontal Jumper.
 %
All objects have object defaults accessible by double clicking the
left mouse button on the corresponding object within the sheet. In
general you can set the default text padding, alignment, font, and
font size for each object.
%
All objects have object defaults accessible by double clicking the
left mouse button on the corresponding object within the sheet. In
general you can set the default text padding, alignment, font, and
font size for each object.
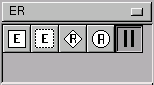
23.5.3 ER
Entity-relationship diagrams are commonly used to design relational
databases. The basic elements of an ER diagram are provided, including
an Entity, Weak Entity, Relationship, Attribute, and Participation.
 %
%
23.5.4 Flowchart
The Flowchart sheet provides the diagram elements usually
associated with drawing flowcharts of all types. All elements allow
text to be included and the object properties can be used to set the
fonts and for boxes to set the corner rounding. The elements supplied
are a Box, Parallelogram, Diamond, Ellipse, Display, Transaction File,
Off Page Connector, Document, Manual Operation, Preparation, Manual
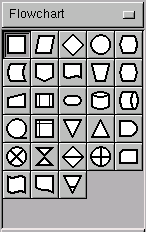 %
Input, Predefined Process, Terminal, Magnetic Disk, Magnetic Drum,
Magnetic Tape, Internal Storage, Merge, Extract, Delay, Summing
Junction, Collate, Sort, Or, Punched Card, Punched Tape, Transmittal
Tape, and Offline Storage.
%
Input, Predefined Process, Terminal, Magnetic Disk, Magnetic Drum,
Magnetic Tape, Internal Storage, Merge, Extract, Delay, Summing
Junction, Collate, Sort, Or, Punched Card, Punched Tape, Transmittal
Tape, and Offline Storage.
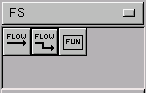
23.5.5 FS
The FS sheet provides support for Function Structure Diagrams.
There are three shapes: A Flow, an
Orthogonal Polyline Flow, and a Function.
 %
%
The Flows have object defaults where default labels (text) and flow types can be identified. These can also be changed by double clicking a Flow or Orthogonal Polyline Flow object on your canvas. The different flow types (Energy, Material, and Signal) change the properties (colour and type) of the line. The text label can be grabbed by the mouse and moved around.
The Function object is a box with a text label. It has object properties with which the Function can be identified as a Wish Function and/or a User Function. A Wish Function has a dotted box and a User Function has a double box.
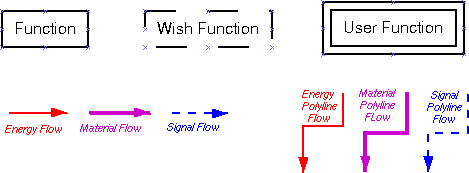 A sample of the Function Structure (FS) Diagram sheet
objects. This is not a true function structure diagram, but does
illustrate the variety of shapes. {#fig:dia-sheet-fs-sample}
A sample of the Function Structure (FS) Diagram sheet
objects. This is not a true function structure diagram, but does
illustrate the variety of shapes. {#fig:dia-sheet-fs-sample}
23.5.6 GRAFCET
GRAFCET charts have been standardised outside of France as
Sequential Function Charts (IEC848). THey are often used to describe
the mandated behaviour of sequential automates. They are in fact an
offspring of Petri nets but oriented towards specification of actions
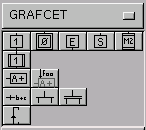 %
and mandated evolutions rather than simple descriptions of state and
possible evolutions.
%
and mandated evolutions rather than simple descriptions of state and
possible evolutions.
The supplied shapes of the GRAFCET sheet include a Regular Step, Initial Step, Macro Entry Step, Macro Exit Step, Macro Call Step, Macro Sub-Program Call Step. These are essentially variations of the same shape and one can be changed to another by editing the object properties. Next are an Action, Condition, Transition, OR Vergent, AND Vergent, and an Arc. The first nine shapes have object defaults for setting the font, font size and pen colour. The Arc can have arrow heads.
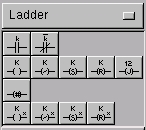
23.5.7 Ladder
Ladders are used as a pseudo-electric representation of
boolean expressions. They are used by some vendors of industrial
automats (including Schneider/T'el'em'ecanique and Siemens).
 %
%
23.5.8 Network Diagrams
Network diagrams include local area networks (LANs) and wide area
networks (WANs). The Network sheet provides a collection of
shapes often used in network diagrams. The sheet includes, in order, a
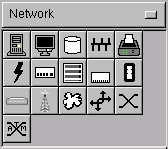 %
Computer, Monitor, Storage, Ethernet Bus, Printer, WAN Connection,
Hub, Modular Switch, RJ45 Wall-Plug, scEAD Wall-Plug, Modem, Antenna
(for wireless transmission), Network Cloud, Router Symbol, Switch
Symbol, and an ATM Switch Symbol.
%
Computer, Monitor, Storage, Ethernet Bus, Printer, WAN Connection,
Hub, Modular Switch, RJ45 Wall-Plug, scEAD Wall-Plug, Modem, Antenna
(for wireless transmission), Network Cloud, Router Symbol, Switch
Symbol, and an ATM Switch Symbol.
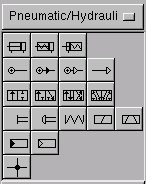
23.5.9 Pneumatic/Hydraulic
The Pneumatic/Hydraulic sheet provides tools to draw pneumatic
and hydraulic schematics. It is a very incomplete sheet, and there are
some tricks to using distributors properly.
 %
%
23.5.10 SADT
SADT stands for Structured Analysis and Design Technique which is a
trademarked and copyrighted by Softech Inc. A SADT model is a
collection of diagrams organised in a tree structure. Each SADT
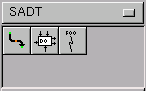 %
diagram is composed of Boxes (representing activities) connected by
Flows (arrows) representing flows of materials, data or information.
%
diagram is composed of Boxes (representing activities) connected by
Flows (arrows) representing flows of materials, data or information.
The SADT sheet provides the three basic components required for drawing SADT diagrams: Activity/Data Flow, Activity/Data box, and Flow Annotation. The activity/data flow can be one of several styles, including Normal, Import Resource, Imply Resource, Dotted Arrow, or with Disabled Arrows. The default is Normal but can be changed in the Object Defaults window (double click the Activity/Data Flow button).
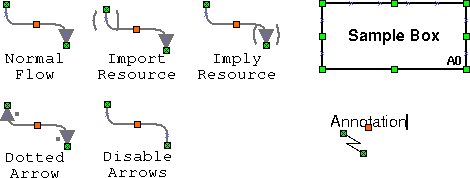
A sample of the SADT digram objects. {#fig:dia-sheet-sadt-sample}
Flows have different roles in relation to the activities. The middle mouse button (or control right click on Windows) is used to add or remove segments.
The default flow is Vertical-Horizontal-Vertical. It is sometimes useful to do a bit of middle mouse button clicking to build a Horizontal-Vertical-Horizontal variant which can then serve for copy-and-paste in your diagram. A non Vertical-Horizontal-Vertical flow will be shown in black instead of the default grey. While this is not in the original SADT specification it is often handy to untangle a heavily loaded sheet (with more than 4 or 5 functions—though these sheets should be avoided).
Connections points can be added to or removed from the sides of an SADT box by clicking the middle mouse button. Function identifier (A0, A1, etc.) can be changed by opening the box properties. The associated function (the contents of the box) is changed by simply selecting the box and typing any text.
23.5.11 Sybase
The Sybase sheet provides various objects for the design of
Sybase replication domain diagrams. The sheet includes a Dataserver,
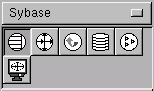 %
Replication Server, Log Transfer Manager or Rep Agent, Stable Storage
Device, Client Application, and a Replication Server Manager.
%
Replication Server, Log Transfer Manager or Rep Agent, Stable Storage
Device, Client Application, and a Replication Server Manager.
23.5.12 UML
Support for the Universal Modelling Language (UML) includes all of the
static structure diagram elements specified in the UML specifications.
The sheet includes, in order, a Class, Template Class, Note,
Dependency, Realization (implements a specific interface),
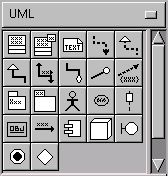 %
Generalisation (class inheritance), Association, Aggregation (one
class is part of another), Implements (class implements a specific
interface), Constraint, Small Package, Large Package, Actor, Usecase,
Lifeline, Object, Message, Component, Node, Class Stereotype Icon,
State Machine, and a Branch.
%
Generalisation (class inheritance), Association, Aggregation (one
class is part of another), Implements (class implements a specific
interface), Constraint, Small Package, Large Package, Actor, Usecase,
Lifeline, Object, Message, Component, Node, Class Stereotype Icon,
State Machine, and a Branch.
Your donation will support ongoing availability and give you access to the PDF version of this book. Desktop Survival Guides include Data Science, GNU/Linux, and MLHub. Books available on Amazon include Data Mining with Rattle and Essentials of Data Science. Popular open source software includes rattle, wajig, and mlhub. Hosted by Togaware, a pioneer of free and open source software since 1984. Copyright © 1995-2022 Graham.Williams@togaware.com Creative Commons Attribution-ShareAlike 4.0